Download
1 / 22
220 likes | 370 Vues
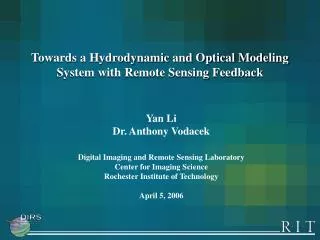
Towards a Hydrodynamic and Optical Modeling System with Remote Sensing Feedback. Yan Li Dr. Anthony Vodacek Digital Imaging and Remote Sensing Laboratory Center for Imaging Science Rochester Institute of Technology April 5, 2006. Objective Methods Modeling (ALGE and Hydrolight 4.1)

E N D
Towards a Hydrodynamic and Optical Modeling System with Remote Sensing Feedback Yan Li Dr. Anthony Vodacek Digital Imaging and Remote Sensing Laboratory Center for Imaging Science Rochester Institute of Technology April 5, 2006
Objective Methods Modeling (ALGE and Hydrolight 4.1) Remote sensing feedback Experimental Design & Data Results Summary Outline
Objective • High resolution plume simulations at the mouth of Niagara River and Genesee River to study the transport and the 3D distribution of CDOM and suspended sediments • Spectral remote-sensing reflectance at various locations in the mouth of Genesee River was calculated • Simulated remote-sensing reflectance compared to remote imagery to provide a feedback mechanism to the hydrodynamic model
ALGE ALGE • 3D finite differencing hydrodynamic model solving momentum, mass and energy conservation equations • Realistic predictions of movement and dissipation of plumes, sediments, and passive tracers discharged into lakes • High resolution simulations for node-to-node matching with satellite thermal imagery or airborne imagery Model output Spatial data Satellite image • Geo-referenced site specific • Bathymetry • Weather data • Inflow and outflow
Basic Hydrolight World solar and atmospheric radiance air/water interface CHL TSS CDOM bottom reflectance
Hydrolight • Radiative transfer numerical model • Input • IOPs (absorption and scattering coefficients, scattering phase function) • state of the wind-blown air/water interface (wind speed) • sky spectral radiance distribution (built-in model/MODTRAN) • nature of the bottom boundary • AOPs (remote sensing reflectance Rrs) Lw: water leaving radiance Ed: evaluated just above the water surface
Physical Forcing Inputs ALGE 3D Distribution of CDOM and TSS Remote Imagery (Plume) Algal Growth Model Hydrolight 4.1 IOPs (a, b, bb) Spectral Rrs or Radiance Remote Imagery or Lab Analysis
Study Area – Niagara River and Genesee River Genesee River Niagara River
Plume Simulation Forcing Factors • Meteorological data was from Buffalo weather station • Discharge flow rate was from US Army Corp. of Eng. Detroit District • The high resolution, limited area simulations of the plume were nudged from large scale whole lake simulation • TSS modeled as particles and CDOM modeled as passive tracers
a(760 nm) = 2.55 (where water absorbs maximally) a(430 nm) = 0.0144 (where water absorbs minimally) Absorption of red light is 177 times stronger than absorption of blue light Absorption coefficients: Pope and Fry (1997) Scattering coefficients: Smith and Baker (1981)
DIRS capabilities for field sampling and in-water measurements (Dr. Tony Vodacek) HydroRad-4 spectroradiometer HydroScat-2 backscatter meter normalized to a(350)=1.0 CDOM no scattering
Assuming chlorophyll scattering goes to zero soon after 700 nm Chlorophyll has maximal absorption coefficients at 430 and 670 nm
Maximal absorption occurs at the lowest wavelengths (~ 350 nm) Absorption falls off rapidly as wavelength increasing Absorption is negligible beyond 500 nm Specific absorption and scattering coefficients are determined by Dr. Vodacek from the May 20, 1999 Lake Ontario water samples
Genesee River Plume LANDSAT-7 visible image showing the Genesee River plume on June, 14 2004 (spatial resolution 30 m)
Genesee River Plume MODIS calibrated and geo-located radiance (L1B) image showing the Genesee River plume on June, 15 2004 (spatial resolution 250 m) Blue circle: plume water Green circle: lake water
visible thermal Modular Imaging Spectrometer Instrument (MISI) Lake Ontario plume • Airborne line scanner • 70 VNIR channels • 5 thermal channels • nominal 2 milliradian FOV (20ft GSD at 10,000ft) • sharpening bands in VIS and LWIR • LWIR thermal band detecting the upwelling track caused by boat traffic • Plume traveling northward because of calm wind conditions on June 7, 2004 • Westward track of the plume shown in MODIS image due to prevailing wind from the east
Niagara River Plume shown by simulated surface flow currents and passive tracer Murthy, C.R., and K.C. Miners. 1989. Mixing characteristics of the Niagara River plume in Lake Ontario. Water Pollution Research Journal of Canada 24(1):143-162.
Simulated Genesee River Plume Suspended sediment concentration profile from ALGE (g/m^3) plume water
CHL profile (Chl0 = 4.2, Zmax = 100, h = 7.5, = 3.0) CDOM absorption as an exponential function of both wavelength and depth Genesee River Plume
Water Quality Conditions • Concentrations (Hydrolight variables) • estimated from laboratory analysis on water samples
Lake Ontario Optical Identification of the Plume compare Rrs Genesee River Plume The shaded bars at the bottom show the nominal SeaWiFs sensor bands
Summary • High resolution hydrodynamic simulations showing the spread of plumes • Simulated vertical profile of suspended sediment from ALGE • Spectral Rrs simulated from lab analysis showing the optical identification of plume • Study of remote satellite/airborne imagery (LANDSAT-7, MODIS, MISI) Future work • Modify ALGE to be spectral on shortwave range (CDOM) • More optical property data for Niagara River Plume • Retrieve more spectral information from remote satellite/airborne imagery (LANDSAT-7, MODIS, MISI)