Download
1 / 68
680 likes | 702 Vues
Explore the evolving technologies in remote sensing for forest measurement with LIDAR and RADAR, their techniques, benefits, and cost-effectiveness. Learn about monitoring forest characteristics and assessing biomass using these advanced tools.

E N D
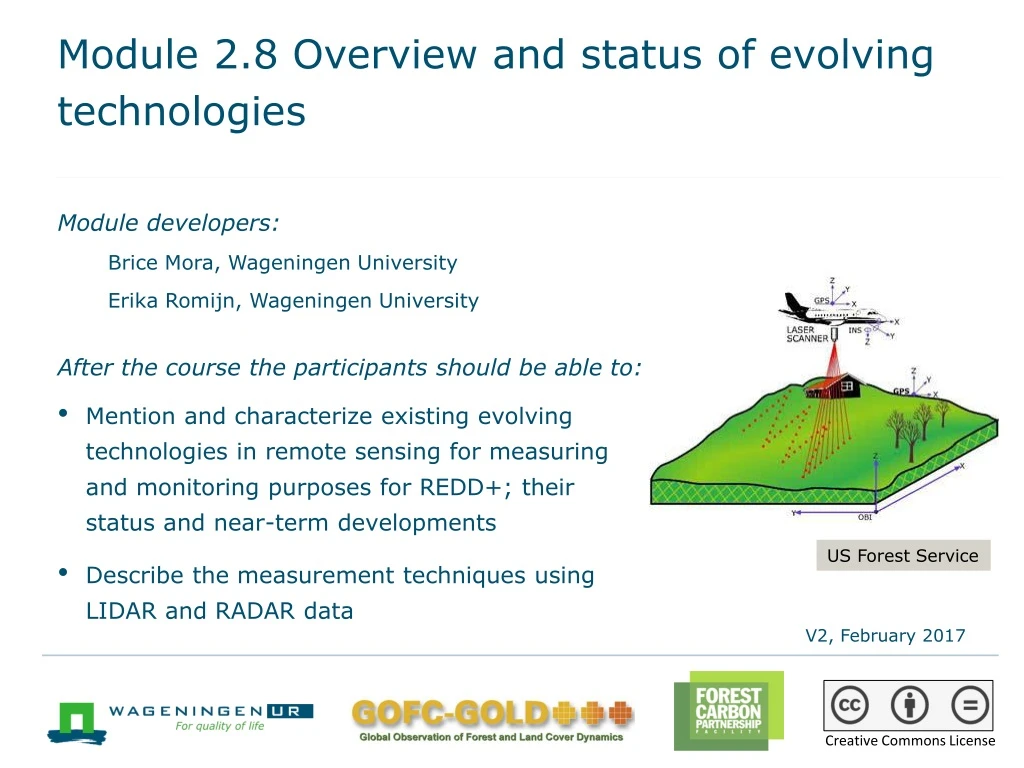
Module 2.8 Overview and status of evolving technologies Module developers: Brice Mora, Wageningen University Erika Romijn, Wageningen University After the course the participants should be able to: • Mention and characterize existing evolving technologies in remote sensing for measuring and monitoring purposes for REDD+; their status and near-term developments • Describe the measurement techniques using LIDAR and RADAR data US Forest Service V2, February 2017 Creative Commons License
Outline of lecture • Role of LIDAR observations for forest characterization and experiences with LIDAR for monitoring purposes • The use of RADAR for forest monitoring
Outline of lecture • Role of LIDAR observations for forest characterization and experiences with LIDAR for monitoring purposes • The use of RADAR for forest monitoring
Background material LIDAR • GOFC-GOLD Sourcebook, 2014. Section 2.10 http://www.gofcgold.wur.nl/redd/index.php • GFOI MGD, 2014. Sections 3.2.4 and 3.2.5 http://www.gfoi.org/methods-guidance-documentation • De Sy, V., Herold, M., Achard, F., Asner, G.P., Held, A., Kellndorfer, J., and Verbesselt, J. (2012) Synergies of multiple remote sensing data sources for REDD+ monitoring. Current Opinion in Environmental Sustainability. 1-11. • McRoberts, R.E., Andersen, H.-E., & Næsset, E. (2014). Using airborne laser scanning data to support forest sample surveys. In: Maltamo, M., Næsset, E., & Vauhkonen, J. (Eds.). Forestry applications of airborne laser scanning. Springer. • McRoberts, R.E., Bollandsås, O.M. (2014). Modeling and estimating change. In: Maltamo, M., Næsset, E., & Vauhkonen, J. (Eds.). Forestry applications of airborne laser scanning. • Næsset E. (1997) Estimating timber volume of forest stands using airborne laser scanner data. Remote Sens Environ 51: 246-253. • Vauhkonen, J., Maltamo, M., McRoberts, R.E., & Næsset, E. (2014). Introduction to forest applications of airborne laser scanning. In: Maltamo, M., Næsset, E., & Vauhkonen, J. (Eds.). Forestry applications of airborne laser scanning. Springer.
LIDAR: Background and characteristics • LIght Detection And Ranging (LIDAR) technology uses active sensors • Information obtained from lasers to estimate the three-dimensional distribution of vegetation canopies as well as subcanopy topography • LIDAR systems classified as either full waveform or discrete return sampling systems, further divided into profiling and scanning systems • LIDAR sensors can estimate tree/stand height, volume, biomass, and stand crown closure Ussyshkin 2011.
Experiences for monitoring purposes (1/3) • Height estimates obtained from airborne remotely sensed LIDAR data have similar or better accuracy than field-based estimates • LIDAR measurement errors can be < 1.0 m for individual tree heights of a given species • LIDAR measurements have no saturation effect • Ground measurements required to estimate relationships between three-dimensional properties of LIDAR point cloud such as canopy height and canopy density and target biophysical properties of interest such as biomass, using parametric or nonparametric statistical techniques A: spaceborne waveform, B: airborne waveform C: discrete return scanning LIDAR D: discrete return profiling LIDAR (Wulder et al. 2012)
Experiences for monitoring purposes (2/3) • Wall-to-wall mode or sampling mode can be used to monitor large areas • Consider sources of error in ground allometric models • More research needed to better assess/consider model errors associated with three-stage LIDAR sampling methods • Co-registrations errors between ground plots and LIDAR data: larger plots (radius >=25m) provide improved biomass accuracy Frazer et al. 2011.
Experiences for monitoring purposes (3/3) • Costs: vary widely, depend on area to monitor (economies of scale possible). In Europe: $0.5-1.0 per hectare, greater in South America using local companies • Recent bids for complete, wall-to-wall LIDAR coverage for a REDD+ demonstration in Tanzania from European data providers were on the order of $0.5-1.0 per hectare • Airborne LIDAR technology may be more cost-effective than other remote sensing technologies, even when data are acquired free of charge, because fewer field observations may be needed to satisfy specified precision level Photo credit: Spies and Olsen, Oregon State U.
Design, modelling, and estimation for LIDAR survey (1/5) • Models based on relationships between forest attributes and LIDAR data commonly constructed using combination of field plot observations and geo-referenced LIDAR metrics • Little empirical information on plot configurations and sampling designs available • Results for boreal and temperate forest studies may not be definitive for tropical applications, but may provide useful guidance on: • GPS location accuracy • Positional error
Design, modelling, and estimation for LIDAR survey (2/5) • Plot shape: • Boreal and temperate forests: Circular plots • Tropical countries: rectangular plots • Pulse densities: • Boreal and temperate forests: >0.1 pulses/m2; plot areas >200 m2; pulse densities 100-225 per plot • May be minimum thresholds for tropical countries • Ground sampling: • Expensive • Capitalize on existing sampling programs (e.g., national forest inventories) to acquire ground training and accuracy assessment data
Design, modelling, and estimation for LIDAR survey (3/5) • LIDAR strips can be designed based on systematically distributed ground plots (e.g., from national forest inventories) • Strips may be also either randomly or systematically distributed over the study area, and the ground plots may be established exclusively within the LIDAR swaths
Design, modelling, and estimation for LIDAR survey (4/5) • Combinations of the scenarios are possible • Yield of data along the transects may also be modulated to mitigate spatial autocorrelation of measures Credit: Natural Resources Canada.
Design, modelling, and estimation for LIDAR survey (5/5) • Stratified random sampling using strata (e.g., heights, coarser biomass map): • Can produce smaller RMSEs (root mean square error) between biomass and LIDAR metrics • Requires fewer extrapolations beyond range of LIDAR sample data when the model applied to entire population • Confidence intervals for the LIDAR-based estimates for large areas necessary in addition to map accuracy measures for categorical forest attribute variables or model RMSE for continuous variables • See Module 2.7. on estimation of uncertainties
Data availability and required national capacities (1/2) • Spaceborne LIDAR data available globally based upon GLAS data, freely available through the National Snow and Ice Data Center, NSIDC (operational period: 2003–2009) • In 2018 GEDI and ICESat-2 spaceborne missions will be launched • Airborne LIDAR data can be acquired for any part of the world, with coverage on-demand via commercial agencies • Airborne data can be collected theoretically anywhere, but costs are typically greater for more unusual locations and where implementation of the survey is more difficult, participation of national agencies may be required • Airborne data can be collected by a variety of instruments, over a range of settings, resulting in data with varying qualities
Data availability and required national capacities (2/2) Mora et al. 2013.
Status, expected near-term developments, and long-term sustainability • Currently no operational space laser • NASA working toward development of new spaceborne LIDAR mission to be flown on ICESat II with utility for estimation of vegetation structure, height, and biomass currently unknown • Launch of ICESat II scheduled for 2017 (http://icesat.gsfc.nasa.gov/icesat2/mission_overview.php) • LIDAR Surface Topography mission (LIST) to collect global LIDAR data over a five-year mission also planned for launch in the 2020s by NASA
Applicability of LIDAR for forest monitoring (1/2) • LIDAR is an emerging technology in terms of large-area monitoring, especially for REDD+ • However, well established as a data source for contributing to satisfaction of forest management and science objectives • Capacity for LIDAR to characterize biomass and biomass change over time positions the technology well to meet REDD+ information needs • “Costs to a program need to be vetted against the information that is acquired, how this information meets the specified needs, and the degree to which the reduction in uncertainty from LIDAR-based estimates offsets initial costs” (Wulder et al. 2012)
Applicability of LIDAR for forest monitoring (2/2) Technical capabilities of remote sensing sensors for the generation of (national) REDD+ information products Very suitable Suitable Contributing Limited to no technical capabilities De Sy et al. 2012.
Terrestrial LIDAR (1/5) • Also known as Terrestrial Laser Scanning (TLS) • Ground-based remote sensing system that can measure 3D vegetation structure • Records scans from a fixed location • Possibility to estimate parameters such as tree height, DBH, volume, above ground biomass, canopy closure A 3D TLS point cloud Calders et al., in REDD Sourcebook, 2015
Terrestrial LIDAR (2/5) Overview of commonly used commercial TLS instruments Calders et al., in REDD Sourcebook, 2015
Terrestrial LIDAR (3/5) Status and outlook • TLS estimates of forest properties have been shown to be of higher-accuracy than traditional survey methods, particularly tree height. • More practical methods of acquiring and processing TLS data needed to develop use of TLS • Relationship between gap probability and significant structural metrics is empirical and not well understood • Current geometric modelling methods provide clear, detailed and accurate characterization of structure on individual tree, but more development required to automate algorithms to provide efficient plot level based estimates
Terrestrial LIDAR (4/5) Status and outlook • TLS data have potential to provide volume information at a fraction of the cost of traditional destructive methods • TLS likely to reduce uncertainty of the resulting AGB values compared with allometric methods that underpin all current field-based and satellite-derived AGB estimates.
Terrestrial LIDAR (5/5) References Anderson, K., Hancock, D., Disney, M. I. and Gaston, K. J. (2016) Is waveform worth it? A comparison of LiDAR approaches for vegetation characterization. Remote Sensing for Ecology and Conservation, 2:5-15. Calders, K., Armston, J., Newnham, G., Herold, M. and Goodwin, N. (2014) Implications of sensor configuration and topography on vertical plant profiles derived from terrestrial LiDAR. Agricultural and Forest Meteorology 194: 104-117. Calders, K., Newnham, G., Burt, A., Murphy, S., Raumonen, P., Herold, M., Culvenor, D., Avitabile, V., Disney, M., Armston, J. and Kaasalainen, M. (2015), Nondestructive estimates of above-ground biomass using terrestrial laser scanning. Methods EcolEvol, 6: 198–208. Jupp, D. L. B., Culvenor, D. S., Lovell, J. L., Newnham, G. J., Strahler, A. H. and Woodcock, C. E. (2009). Estimating forest lai profiles and structural parameters using a ground-based laser called echidna. Tree physio Newnham, G., Armston, J., Muir, J., Goodwin, N., Tindall, D., Culvenor, D., Puschel, P., Nystrom, M., & Johansen, K. (2012). Evaluation of terrestrial laser scanners for measuring vegetation structure. CSIRO Sustainable Agriculture Flagship. Ni-Meister, W., Lee, S., Strahler, A. H., Woodcock, C. E., Schaaf, C., Yao, T., Ranson, K. J., Sun, G. and Blair, J. B. (2010). Assessing general relationships between aboveground biomass and vegetation structure parameters for improved carbon estimate from lidar remote sensing. Journal of Geophysical Research, 115: G00E11.
In summary • LIDAR technology uses active sensors • LIDAR sensors can estimate tree/stand height, volume, biomass, forest structure, and stand crown closure • LIDAR measurements have high accuracy, comparable to field measurements • Relationships are established between three-dimensional properties of LIDAR point cloud (canopy height and canopy density) and biophysical properties (biomass), using allometric equations • LIDAR is an emerging technology in terms of large-area forest monitoring, especially for REDD+
Outline of lecture • Role of LIDAR observations for forest characterization and experiences with LIDAR for monitoring purposes • The use of RADAR for forest monitoring
Background material RADAR • De Sy, V., Herold, M., Achard, F., Asner, G.P., Held, A., Kellndorfer, J., and Verbesselt, J. (2012) Synergies of multiple remote sensing data sources for REDD+ monitoring. Current Opinion in Environmental Sustainability. 1-11. • GOFC-GOLD Sourcebook section 2.10 http://www.gofcgold.wur.nl/redd/index.php • Gibbs HK, Brown S, Niles JO, Foley JA (2007) Monitoring and estimating tropical forest carbon stocks: making REDD a reality. Environ Res Lett, 2:045023. Synthesizes options to estimate national-level forest biomass carbon stocks in developing countries and proposes methods to link forest carbon and deforestation estimates. • Sarker, L. R., Nichol, J., & Mubin, A. (2013). Potential of Multiscale Texture Polarization Ratio of C-band SAR for Forest Biomass Estimation. In A. Abdul Rahman, P. Boguslawski, C. Gold, & M. N. Said (Eds.), Developments in Multidimensional Spatial Data Models (Springer., pp. 69–83). Berlin, Heidelberg: Springer Berlin Heidelberg. doi:10.1007/978-3-642-36379-5.
Synthetic Aperture Radar (SAR) technology • SAR sensors used since the 1960s to produce images of earth-surface based on the principals of radar (radio detection and ranging) reflectivity • SAR based on relative motion between sensor’s antenna and target: implemented using usually a moving platform (aircraft, space shuttle, satellite) • Radar is an active system, meaning it serves as the source of its own electromagnetic energy
Radar backscattering mechanisms (1/3) • Radar transmits a pulse (travelling velocity is equal to velocity of light) • Some of the energy in the radar pulse is reflected back toward the radar • This is what the radar measures:It is known as radar backscatter σ0 Source: Lopez-Dekker 2011.
Radar backscattering mechanisms (2/3) Source: Thiel 2011.
Radar backscattering mechanisms (3/3) Source: Lopez-Dekker 2011.
Location of radar in the electromagnetic spectrum (1/2) • While optical sensors operate primarily in the visible and infrared (ca. 0.4-15.0 μm) portions of electromagnetic spectrum, radar sensors operate in microwave region (ca. 3-70 cm) • Electromagnetic waves in visible and infrared range are scattered by atmospheric particulates (e.g., haze, smoke, and clouds); microwave signals generally penetrate through them => added value for imaging tropical forests covered by clouds
Location of radar in the electromagnetic spectrum (2/2) Source: http://canadiansubsurface.com/ir.html
Synthetic aperture radar (SAR) technology • Microwaves penetrate into forest canopies, amount of backscattered energy intensity dependant in part on: • System parameters - incidence angle - wavelength - polarisation • Surface conditions - roughness - geometric shape - dielectric properties of the target => Backscatter signal provides useful information on forest structural attributes including structural forest cover type and aboveground biomass
Surface roughness • Backscattered energy intensity generally increases with surface roughness, for a given wavelength. The surface appears rough to shorter wavelength => Backscattering increases The surface appears smooth to long wavelength => Backscattering is low
Dielectric constant • Controlled by moisture content of the target • Varies commonly between 1 and 100, • e.g., dry natural materials: 3-8; water: 80 • Radar backscatter is influenced by amount of moisture in vegetation and soil • Increased moisture reduces penetration of the radar signal Source: Walker n.d.
Preprocessing of radar signal • Radar signal requires preprocessing to deal with: • Geometric distortions such as foreshortening and layover • Topographic effects resulting in different illumination conditions in the scene • Speckle noise • Commercial and noncommercial software are available
Geometric distortions (1/3) Source: Radiotuorial n.d., http://www.radartutorial.eu/20.airborne/ab07.en.html.
Geometric distortions (2/3) Foreshortening Source: Radiotutorial n.d., http://www.radartutorial.eu/20.airborne/ab07.en.html.
Geometric distortions (3/3) Layover Source: Radiotutorial n.d., http://www.radartutorial.eu/20.airborne/ab07.en.html.
Topographic effects Shadowing Source: Radiotutorial n.d., http://www.radartutorial.eu/20.airborne/ab07.en.html.
Preprocessing of radar signal (cont’d) • Speckle noise affects radar images, reducing class spectral seperability • Results from random fluctuations in the return signal from an object • Preprocessing required to filter the images minimizing loss of information Source: Lopez-Dekker, 2011 original SAR image Airborne SAR AeS-1 speckle filtered Model based approach
Preprocessing chain Level 1 SLC SAR image Preprocessed intensity SAR image Import with header info extraction Speckle filtering Intensity image Feature extraction (land-cover mapping, change detection, etc.) Multilooking process Radiometric calibration Geocoding with DEM Topographic normalization with DEM
Radar band characteristics (1/4) • Active: radars illuminate the target so that they can operate day and night • Microwave frequencies: • Electromagnetic waves penetrate to some extent through media • At most frequencies clouds are transparent • Complex interaction with medium or target: a radar image is not a photo • Spatial resolution fundamentally constrained: • Do not expect 1cm resolution SAR images at C-band
Radar band characteristics (2/4) Source: Lopez-Dekker 2011.
Radar band characteristics (3/4) Credit: Le Toan.
Radar band characteristics (4/4) Forest at different frequencies L Band C Band Source: Thiel 2011.
SAR techniques: Polarimetry • Radar waves have polarization • Anisotropic materials can reflect waves at different polarizations and intensities • Some material can convert a(n) (incoming) polarization into another one (returning) • Multiple images can be generated from the same series of pulses Source: Thiel 2011. Vertical polarization Horizontal polarization
Radar for forest monitoring Global ALOS PALSAR color composite mosaic (Red:HH, Green:HV, Blue:HH/HV), 25 m pixel spacing, 70,000 scenes, acquired between June-October 2009 Source: JAXA 2009.
Radar for forest monitoring SAR (Shuttle Radar Topography Mission SRTM data) demonstrated capacity for retrieving forest height across larger areas: • JERS-1 SAR mission provided first consistent pan-tropical and pan-boreal observations; long wavelength L-band SAR data proved useful for forest/nonforest classification and identification of secondary growth • L-band data also facilitated temporal mapping of standing water below closed-canopy forests with time-series => floodplain versus swamp forests differentiation