Download
1 / 62
750 likes | 1.13k Vues
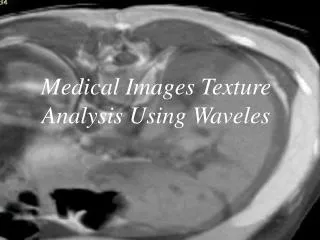
Texture Analysis and Its Applications in Medical Imaging. Edward J. Delp. Purdue University School of Electrical and Computer Engineering Video and Image Processing Laboratory ( VIPER) West Lafayette, Indiana, USA email: ace@ecn.purdue.edu http://www.ece.purdue.edu/~ace. Breast Cancer.

E N D
Texture Analysis and Its Applications in Medical Imaging Edward J. Delp Purdue University School of Electrical and Computer Engineering Video and Image Processing Laboratory (VIPER) West Lafayette, Indiana, USA email: ace@ecn.purdue.edu http://www.ece.purdue.edu/~ace
Breast Cancer • Second major cause of cancer death among women in the United States (after lung cancer) • Leading cause of nonpreventable cancer death • 1 in 8 women will develop breast cancer in her lifetime • 1 in 30 women will die from breast cancer
Mammography • Mammograms are X-ray images of the breast • Screening mammography is currently the best technique for reliable detection of early, non-palpable, potentially curable breast cancer • Studies show that mammogram can reduce the overall mortality from breast cancer by up to 30%
Density 1 Density 2 Density 3 Density 4 Analysis of Mammograms
Digital Mammography • Resolution - 50 pixel size • 3000 x 4000 pixels (12,000,000 pixels) • 8-16 bits/pixels • 8 bits/pixel (12 MB) • 16 bits/pixel (24 MB) • Each study consists of 48-96 MB! • 200 patients per day can results to 20GB/day • Problems with storage and retrieval
Problems in Screening Mammography • Radiologists vary in their interpretation of the same mammogram • False negative rate is 4 – 20% in current clinical mammography • Only 15 – 34% of women who are sent for a biopsy actually have cancer
Current Research in Computer Aided Diagnosis (CAD) • The goal is to increase diagnostic accuracy as well as the reproducibility of mammographic interpretation • Most work aims at detecting one of the three abnormal structures • Some have explored classifying breast lesions as benign or malignant • The implementation of CAD systems in everyday clinical applications will change the practice of radiology
Three Types of Breast Abnormalities Micro-calcification Circumscribed Lesion Spiculated Lesion
Extremely vary in form, size, density, and number, usually clustered within one area of the breast, often within one lobe Malignant Microcalcifications Casting: fragments with irregular contour, differ in length Granular: dot-like or elongated, tiny, innumerable
Benign Microcalcifications Homogenous, solid, sharply outlined, spherical, pearl-like, very fine and dense Crescent-shaped or elongate Linear, often needle like, high and uniform density Ring surrounds dilated duct, oval or elongated, varying lucent center, very dense periphery
Benign Microcalcifications (Cont.) Egg-shell, center radiolucent or of parenchymal density Ring-shaped, oval, center radiolucent, occur within skin Similar to raspberry, high density but often contain small, oval-shaped lucent areas Coarse, irregular, sharply outlined and very dense
Malignant Masses High density radiopaque Solid tumor, may be smooth or lobulated, random orientation
Benign Masses Halo: a narrow radiolucent ring or a segment of a ring around the periphery of a lesion Capsule: a thin, curved, radiopaque line that surrounds lesions containing fat Cyst: spherical or ovoid with smooth borders, orient in the direction of the nipple following the trabecular structure of the breast
Benign Masses (Cont.) Radiolucent density Radiolucent and radiopaque combined Low density radiopaque
Malignant Spiculated Lesions Scirrhous carcinoma: distinct central tumor mass, dense spicules radiate in all directions, spicule length increases with tumor size Early stage scirrhous carcinoma: tumor center small, may be imperceptible, only a lace-like, fine reticular radiating structure which causes parenchymal distortion and/or asymmetry
Benign Spiculated Lesions Sclerosing duct hyperplasia: translucent, oval or circular center, the longest spicules are very thin and long, spicules close to the lesion center become numerous and clumped together in thick aggregates Traumatic fat necrosis: translucent areas are within a loose, reticular structure, spicules are fine and of low density
Statistical Segmentation of Mammograms Mary L. Comer, Sheng Liu, and Edward J. Delp • Abnormalities in mammograms are disruptions of the normal structures • It is desirable to partition a mammogram into texture regions • Study the use of a new statistical method for the detection of abnormalities in mammograms
Non-statistical Approaches • Use a series of heuristics, such as filtering, thresholding, and texture analysis • Suffer from a lack of robustness when the number of images to be classified is large
EM/MPM Algorithm • Assign each pixel in the mammogram membership to one of 3 texture classes: tumor, normal tissue, and background, depending on statistical properties of the pixel and its neighborhood • Both the original mammogram and its class labels are modeled as discrete parameter random fields • Use a combination of the expectation-maximization and the maximization of the posterior marginals (EM/MPM) algorithms to segment mammograms
Advantages • The values of all parameters of the MPM algorithm need not be known a priori • Provide indication of the reliability of each classified pixel • Detect various types of tumors within the same framework
Database • Images used in this research were provided courtesy of the Center for Engineering and Medical Image Analysis at the University of South Florida • Abnormal mammograms have an interpretation file that indicates the types and positions of abnormalities • 220 micron resolution
Experiments • The spatial interaction parameter and cost parameters were determined experimentally using a variety of mammography images • a priori knowledge is used to initialize the model parameter vector • The reliability information is displayed as an image where pixel values are proportional to the estimated marginal conditional probability mass function of the label field: larger graylevel higher reliability of classification
Experimental Results Original mammogram Segmented image Ground truth Reliability image
Experimental Results (Cont.) Original mammogram Segmented image Ground truth Reliability image
Multiresolution Detection of Spiculated Lesions in Digital Mammograms Sheng Liu and Edward J. Delp • Spiculations or a more stellate appearance in mammograms indicates with near certainty the presence of breast cancer • Detection of spiculated lesions is very important in the characterization of breast cancer
Difficulties • Center masses of spiculated lesions are usually irregular with ill-defined borders • In some cases, the center masses are too small to be perceptible • Spiculated lesions vary from a few millimeters to several centimeters in size
Difficulties (Cont.) • Computer aided diagnosis of digital mammograms generally consists of feature extraction followed by classification • It is very difficult to determine the neighborhood size that should be used to extract features which are local • If the neighborhood is too large, small lesions may be missed • If the neighborhood is too small, one may not be able to capture features of larger lesions
Block Diagram of Multiresolution Detection of Spiculated Lesions
Multiresolution Decomposition • Linear phase nonseparable 2D perfect reconstruction wavelet transform • does not introduce phase distortions in the decomposed images • no bias is introduced in the horizontal and vertical directions as a separable transform would • The impulse response of the analysis low pass filter
Advantages ofMultiresolution Approach • Overcomes the difficulty of choosing a neighborhood size a priori (variable lesion size) • Requires less computation by • starting with the least amount of data • propagating detection results to finer resolutions
A Spiculated Lesion Distorts the Normal Breast Duct Structure • Normal duct structures of the breast radiate from the nipple to the chest wall • Spiculated lesion radiates spicules in all directions
Gradient Orientation Histogram • Has a peak at the ductal structure orientation near a normal pixel • Flat near a lesion pixel
Example Histograms A normal region A spiculated region
Notation • (i, j) — spatial location at row i and column j • f(i, j) — pixel intensity at (i, j) • Sij— some neighborhood of (i, j) • M — the number of pixels within Sij • Dy(i, j) and Dx(i, j) — estimate of the vertical and horizontal spatial derivatives of f at (i, j), respectively • (i, j) = tan-1{Dy(i, j)/Dx(i, j)} (-/2, /2] — estimate of the gradient orientation at (i, j)
Notation (Cont.) • histij — histogram of within Sij using 256 bins • histij(n) — # of pixels in Sij that have gradient orientations , where n = 0, 1, …, 255 • — average bin height of histij
Folded Gradient Orientation • M+(i, j) and M-(i, j) — number of positive and negative gradient orientations within Sij, respectively • and — average positive and negative gradient orientations, respectively — folded gradient orientation
Features Differentiate Spiculated Lesions from Normal Tissue • Mean pixel intensity in Sij — • Standard deviation of pixel intensities in Sij —
Features Differentiate Spiculated Lesions from Normal Tissue (Cont.) • Standard deviation of gradient orientation histogram in Sij — • Standard deviation of the folded gradient orientations in Sij —
Why Folded Gradient Orientation? So that is not sensitive to the nominal value of , but to the actual gradient orientation variances • The gradient orientation distance between /2 and -/4 is the same as that between /2 and /4, however • ([/2, -/4]) = 2.8 • ([/2, /4]) = 0.3 • -/4 folds to 3/4, now • ’([/2, -/4]) = ’([/2, /4]) = 0.3
Multiresolution Feature Analysis An MM region at a coarser spatial resolution N/nN/n corresponds to an nMnM region in the original mammogram with spatial resolution NN if a set of features extracted within an 88 window at the original resolution NN can capture spiculated lesions of size 1mm, then the same set of features extracted at the coarser resolution N/4N/4, using the same sized 88 window, should be able to detect spiculated lesions of size 4mm.
Multiresolution Feature Analysis (Cont.) • Choose a neighborhood that is small enough to capture the smallest possible spiculated lesion in the finest resolution • Fix this neighborhood size for feature extraction at all resolutions • Larger lesions will be detected at a coarser resolution • Smaller lesions can be detected at a finer resolution
Test Pattern at Multiple Resolutions An ideal spiculated lesion and normal duct structures embedded in uncorrelated Gaussian distributed noise
Multiresolution Feature Extraction • Each feature at different resolutions is extracted within same sized circular neighborhoods • Features are able to discriminate a spiculated lesion from complex background when extracted within an appropriate neighborhood whose size matches to that of the lesion • Fail when the sizes mismatch