Download
1 / 48
500 likes | 854 Vues
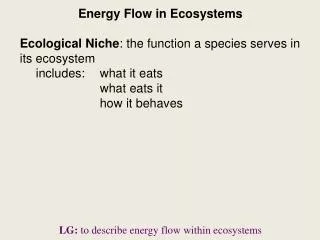
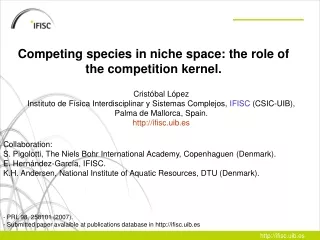
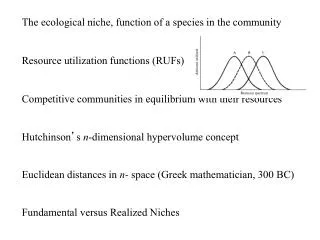
The ecological niche, function of a species in the community Resource utilization functions (RUFs) Competitive communities in equilibrium with their resources Hutchinson ’ s n -dimensional hypervolume concept Euclidean distances in n- space (Greek mathematician, 300 BC)

E N D
The ecological niche, function of a species in the community Resource utilization functions (RUFs) Competitive communities in equilibrium with their resources Hutchinson’s n-dimensional hypervolume concept Euclidean distances in n- space (Greek mathematician, 300 BC) Fundamental versus Realized Niches
Resource matrices of utilization coefficients Niche dynamics Niche dimensionality and diffuse competition Complementarity of niche dimensions Niche Breadth: Specialization versus generalization. Similar resources favor specialists, different resources favor generalists Periodic table of lizard niches (many dimensions) Thermoregulatory axis: thermoconformers —> thermoregulators
Experimental Ecology Controls Manipulation Replicates Pseudoreplication Rocky Intertidal Space Limited System Paine’s Pisaster removal experiment Connell: Balanus and Chthamalus Menge’s Leptasterias and Pisaster experiment Dunham’s Big Bend saxicolous lizards Brown’s Seed Predation experiments Simberloff-Wilson’s defaunation experiment
Bruce Menge (1972)
Menge 1972 Bruce Menge
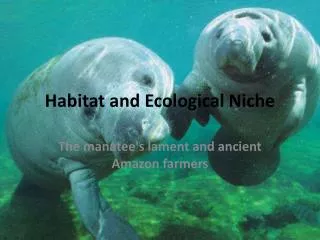
Grapevine Hills, Big Bend National Park Sceloporusmerriami and Urosaurusornatus Six rocky outcrops: 2 controls, 2 Sceloporus removal plots and 2 Urosaurus removal areas. ======================================================== 4 year study: 2 wet and 2 dry: insect abundances Monitored density, feeding success, growth rates, body weights, survival, lipid levels Urosaurus removal did not effect Sceloporus density No effects during wet years (insect food plentiful) Insects scarce during dry years: Urosaurus growth and survival was higher on Sceloporus removal plots Arthur Dunham
James Brown Pogonomyrmex harvester ants Dipodomys kangaroo rats
Experimental Design of Seed Predation in the Chihuahuan Desert___________________________________________________ Plots Treatments___________________________________________________ 11,14 Controls 6,13 Seed addition, large seeds, constant rate 2,22 Seed addition, small seeds, constant rate 9,20 Seed addition, mixed seeds, constant rate 1,18 Seed addition, mixed seeds, temporal pulse5,24 Rodent removal, Dipodomys spectabilis (largest kangaroo rat)15,21 Rodent removal, all Dipodomys species (kangaroo rats) 7,16 Rodent removal, all seed-eating rodents 8,12 Pogonomyrmex harvester ants 4,17 All seed-eating ants 3,19 All Dipodomys plus Pogonomyrmex ants10,23 All seed-eating rodents plus all seed-eating ants___________________________________________________________Munger, J. C. and J. H. Brown. 1981. Competition in desert rodents: an experiment with semipermeable enclosures. Science 211: 510-512.
open circles = rodents removed solid circles = controls
Defaunation Experiments in the Florida Keys Islands of mangrove trees were surveyed and numbers of arthropod species recorded Islands then covered in plastic tents and fumigated with methyl bromide Islands then resurveyed at intervals to document recolonization Simberloff and Wilson 1970
Evidence for Stability of Trophic Structure? First number is the number of species before defaunation, second in parentheses is the number after_______________________________________________________________________________________ Trophic Classes ______________________________________________________________________________Island H S D W A C P ? Total_______________________________________________________________________________________ E1 9 (7) 1 (0) 3 (2) 0 (0) 3 (0) 2 (1) 2 (1) 0 (0) 20 (11)E2 11 (15) 2 (2) 2 (1) 2 (2) 7 (4) 9 (4) 3 (0) 0 (1) 36 (29)E3 7 (10) 1 (2) 3 (2) 2 (0) 5 (6) 3 (4) 2 (2) 0 (0) 23 (26)ST2 7 (6) 1 (1) 2 (1) 1 (0) 6 (5) 5 (4) 2 (1) 1 (0) 25 (18)E7 9 (10) 1 (0) 2 (1) 1 (2) 5 (3) 4 (8) 1 (2) 0 (1) 23 (27)E9 12 (7) 1 (0) 1 (1) 2 (2) 6 (5) 13 (10) 2 (3) 0 (1) 37 (29)Totals 55 (55) 7 (5) 13 (8) 8 (6) 32 (23) 36 (31) 12 (9) 1 (3) 164 (140) _______________________________________________________________________________________H = herbivoreS = scavengerD = detritus feederW = wood borerA = antC = carnivorous predatorP = parasite? = undetermined
Predator-Prey Experiments Georgii F. Gause
Predator-Prey Experiments Georgii F. Gause
Predator-Prey Experiments Georgii F. Gause
Lotka-Volterra Predation Equations coefficients of predation, p1 and p2 dN1 /dt = r1 N1 – p1 N1 N2 dN2 /dt = p2 N1 N2 – d2 N2 No self damping (no density dependence) dN1 /dt = 0when r1 = p1 N2or N2 = r1 / p1 dN2 /dt = 0when p2 N1 = d2 or N1 = d2 / p2 Alfred J. Lotka Vito Volterra
Neutral Stability (Vectors spiral in closed loops)
Vectors spiral inwards (Damped Oscillations)
Damped Oscillations
Prey self damping Vectors spiral inwards (Damped Oscillations)
Robert MacArthur Mike Rosenzweig
Robert MacArthur Mike Rosenzweig
<—Mike Rosenzweig Robert MacArthur —> Moderately efficient predator Neutral stability — Vectors form a closed ellipse. Amplitude of oscillations remains constant.
<—Mike Rosenzweig Robert MacArthur —> Unstable — extremely efficient predator Vectors spiral outwards until a Limit Cycle is reached
<—Mike Rosenzweig Robert MacArthur —> Damped Oscillations — inefficient predator Vectors spiral inwards to stable equilibrium point
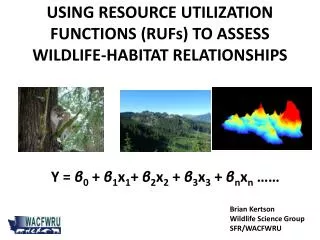
Functional response = rate at which Individual predators capture and eat more prey per unit time as prey density increases C. S. Holling
Numerical response = increased prey density raises the predator’spopulation size and a greater number of predators consume An increased number of prey
Gause’s Didinium ExperimentsLotka-Volterra Predation Equations: N1 N2 = Contacts coefficients of predation,p1and p2 dN1 /dt = r1 N1 – p1 N1 N2 dN2 /dt = p2 N1 N2 – d2 N2No self damping (no density dependence) dN1 /dt = 0when r1 = p1 N2or N2 = r1 / p1 dN2 /dt = 0when p2 N1 = d2 or N1 = d2 / p2Neutral StabilityPrey RefugesFunctional and Numerical Responses
Adding Prey self-damping stabilizes Prey-Predator isocline analyses Predator efficiency, Prey escape ability Prey refuges, coevolutionary race Predators usually destabilizing
Prey Isocline Hump Efficient Predator —> unstable Inefficient Predator —> stable Predator Switching, frequency dependence, stabilizes “Prudent” Predation and Optimal Yield Feeding territories Consequence of senescence
Predator Escape TacticsAspect Diversity Cryptic coloration (countershading) Disruptive coloration Flash coloration Eyespots, head mimicry Warning (aposematic) coloration Alarm signals Hawk alarm calls Selfish callers Plant secondary chemicals
Industrial Melanism Numbers of Typical and Melanic Marked Moths (Bistonbetularia) Released and Recaptured in a Polluted Woods Near Birmingham and an Unpolluted Woods Near Dorset* __________________________________________________________ Polluted Woods Unpolluted Woods __________________________________________________________ Numbers of marked moths released Typical 64 496 Melanic 154 473 Number of moths recaptured Typical 16 (25%) 62 (12.5%) Melanic 82 (53%) 30 (6.3%) __________________________________________________________ * The wild population in the polluted woods was 87% melanic. Source: From data of Kettlewell (1956).
Head Mimicry Papilio caterpillar Pit Viper caterpillar DeVries Snake head