Download
1 / 13
130 likes | 253 Vues
Seasonal variations in C and H 2 O cycling of a tropical transitional forest. George L Vourlitis 1 , Nicolau Priante Filho 2 , José de Souza Nogueira 2 , Luciana Sanches 2 , Fernando Raiter 3 , Wander Hoeger 3 , Eduardo Jacusiel Miranda 2 , George Sanches Suli 2 , Carla Maria Abido Valentini 2.

E N D
Seasonal variations in C and H2O cycling of a tropical transitional forest George L Vourlitis1, Nicolau Priante Filho2, José de Souza Nogueira2, Luciana Sanches2, Fernando Raiter3, Wander Hoeger3, Eduardo Jacusiel Miranda2, George Sanches Suli2, Carla Maria Abido Valentini2 1Department of Biological Sciences, California State University, San Marcos, CA 92096, USA. 2Departamento de Fisica, Universidade Federal de Mato Grosso, Cuiaba, MT, Brasil 3Instituto Universitario do Norte Matogrossense, Universidade Federal de Mato Grosso, Sinop, MT, Brasil
Research Objectives • To quantify the season and interannual patterns of C and H2O cycling processes for a tropical transitional forest. • To understand how these processes are altered by variations in: • - meteorology • - hydrology
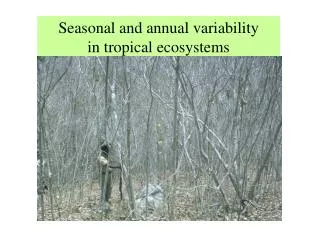
Characteristics of tropical transitional forest • Rain forest • Annual rainfall = 2.3 m • Dry season length = 0-2 months • Canopy height = 35-40 m • LAI = 5-6 m2/m2 • Transitional forest • Annual rainfall = 2.0 m • Dry season length = 3-4 months • Canopy height = 25-30 m • LAI = 2.5-6 m2/m2 • Cerrado • Annual rainfall = 1.5 m • Dry season length = 3-5 months • Canopy height < 20 m • LAI = 0.5-2.5 m2/m2 Data from INPE (2003); Vourlitis et al. (2002); Eiten (1976); Miranda et al. (1996); Vourlitis et al. (2004); Malhi et al. (1998); Rocha et al. (2002).
Eddy covariance measurements of net CO2 exchange (NEE) and evapotranspiration (ET) • Sensors at 42 m (a.g.l.) • 3d sonic, open-path IRGA • 10 Hz sampling • WPL and u* corrections • CO2 storage • Measurement period: August 1999-present
Meteorological measurements Radiation: Net, global, PAR (incident, reflected, transmitted (20, 10, and 1 m). Rainfall Not shown: Soil heat flux; canopy/soil temperature profile; soil moisture; water table depth. Humidity and air temperature (30 and 40 m)
Ancillary measurements Leaf gas exchange: Seasonal, various species/ canopy heights Litter fall: Monthly, n = 20 plots Litter pool: Monthly, n = 20 plots Soil respiration: Monthly, n = 20 plots
Seasonal trends in rainfall and soil moisture Mean (+ 1SD) monthly precipitation and surface (0-30 cm) volumetric soil water content between January 2001-December 2003. From Miranda et al., (in review).
Seasonal trends in Amax, R25, and Gc Amax = estimated maximum rate of gross primary production. R25 = estimated ecosystem respiration rate @ 25oC. Gc = mid-day (1000-1400 h) canopy conductance. Data are means + 95% CI From Vourlitis et al., 2002 and 2004.
Seasonal trends in leaf and total litter fall Monthly leaf and total litter fall (+ 1SD; n = 20 plots) averaged over the last 3 years. From Sanches et al. (in prep.).
Maximum cross-correlation coefficients (rmax) for monthly C and H2O flux time series vs. rainfall and surface (0-30 cm) soil moisture time series. Lag (1) = rainfall or soil moisture of the previous month; Lag (0) = rainfall or soil moisture of the current month. All rmax values are significantly different from r = 0 (p < 0.05). Modified from Vourlitis et al. (2004).
Cerrado Transitional Forest Rain forest Comparison to other tropical ecosystems Annual NEE range = Monthly maximum NEE - Monthly minimum NEE Data from Keller et al. (2004); Rocha et al. (2002); Saleska et al. (2003); Vourlitis et al. (2004)
Conclusions • Seasonal variations in C and H2O cycling processes are highly correlated with rainfall and soil moisture. • C and H2O cycling processes may lag behind rainfall and/or soil moisture because of lags in vegetation response. • Rainfall sensitivity of NEE declines with an increase in annual rainfall.


![K a = [ H + ] [ C 2 H 3 O 2 - ] [ HC 2 H 3 O 2 ]](https://cdn2.slideserve.com/5089471/slide1-dt.jpg)