Download
1 / 27
300 likes | 641 Vues
Interpretation of PIV measurements of open channel flow over rough bed using double-averaged Navier-Stokes equations. D. Pokrajac, I. McEwan, L. Cambell, C. Manes V. Nikora (EPSRC grants GR/R51865/01 & GR/L54448/01). NATO ASI, 2-14 5 2004 Kyev, Ukraine.

E N D
Interpretation of PIV measurements of open channel flow over rough bed using double-averaged Navier-Stokes equations D. Pokrajac, I. McEwan, L. Cambell, C. ManesV. Nikora (EPSRC grants GR/R51865/01 & GR/L54448/01) NATO ASI, 2-14 5 2004 Kyev, Ukraine
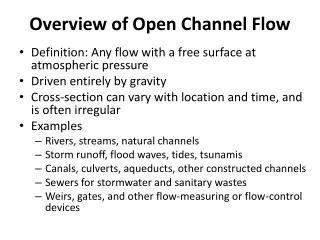
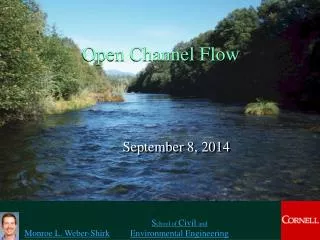
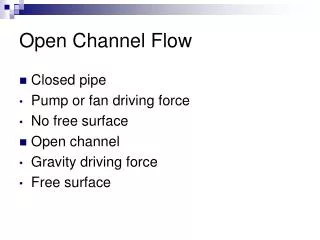
Introduction Shallow open channel flow over rough bed Double Averaging Methodology Experiments PIV Rough impermeable Rough permeable from Nikora et al. 2001
Double AveragingNotation Volume of fluid Vf Porosity f = Vf /V0 Intrinsic average of general quantity F Spatial disturbance of F
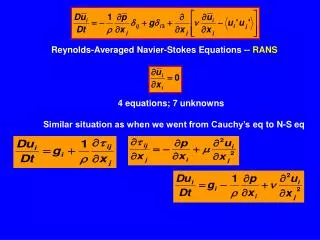
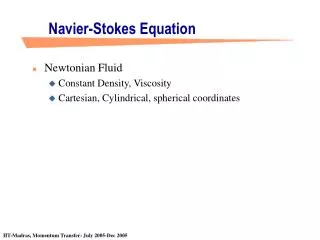
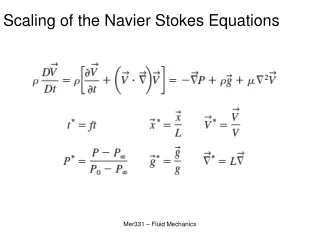
Double AveragingMomentum Equations • Time (ensemble) averaged Navier-Stokes equations • Double averaged Navier-Stokes equations for frozen boundary Sintwith no-slip condition FORM-INDUCED STRESS TERM FORM DRAG VISCOUS DRAG
z w v u x Double AveragingCoordinate System x= longitudinal (u component of velocity vector) y = transverse (vvelocity component) z= bed-normal (‘vertical’ – wvelocity component)
Double Averaging2-D Steady Uniform Flow • Streamwise momentum equation • Flow above the roughness crests • Flow below the roughness crests, frozen boundary, no-slip Note that f=f(z) !
Experimental MethodologyFacilities • The Aberdeen Environmental Hydraulics Group is a long-established PIV user, having had a working PIV system since 1994. • Current facilities include: • Autocorrelation and cross-correlation PIV 1k 1k cameras • taking up to 30 frames/s (15 pairs for cross-correlation) • Direct-to-disk recording allowing long time-series data • (limited only by drive free space) • Choice of Visiflow or VidPIV vector processing software • Illumination via argon-ion or copper vapour lasers (suitable • for high speed PIV) • Two hydraulic flumes (including sediment recirculation), • a wave tank, and oscillatory flow tunnel (OFT)
Experimental MethodologyPIV • Each experiment involved grabbing 4096 multiply/doubly exposed PIV frames at around 16 Hz (around 4 minutes of real-time flow, over 4GB of data) • Pixel resolution was 1000 1000, corresponding to a planar flow area illuminated in the midline of the flume of up to 100 100 mm • Individual frames were broken into 32 32 pixel interrogation regions for autocorrelation/cross-correlation analysis; to produce the final vector map these were overlapped by 75% • Resultant vector maps contained 3481 instantaneous velocity vectors for each of the 4096 time-steps
Experimental MethodologyBed Roughness • 2D square-bar roughness (6 mm) • Spheres (12 mm) in cubic arrangement • 1 layer (impermeable bed) • 2 layers (permeable bed) • A fixed, planar, non-porous sediment bed (d50 = 1.95mm) • with clear water • With the addition of 3 bed-load transport conditions: fine grains, medium grains, coarse grains
g lx = lz = d 2D Square Bar RoughnessSetup lx= lz = d = 6mm Spacing • = 2,3,4,5,6,7,8,10,15,20 Slope S=1:100,1:400,1:1000 Depth H=35mm,50mm,80mm
2D Square Bar RoughnessAnimated Streamwise Velocity Magnitude k type d type
2D Square Bar RoughnessTime averaged velocity components l= 3 l= 5 l= 15 u w
2D Square Bar RoughnessNormalised Shear Stresses • = 3 • = 5 • l = 15
SpheresSetup Diameterd=12mm Slope1:400 Depth H = 80 mm
SpheresTime averaged velocity components Between Above u w
Plane Bed with Gravel Roughness Setup Fixed sediment and bed-load feed material • clear water • d50 = 1.95 mm • fine grains • d50 = 0.77 mm • medium grains • d50 = 1.99 mm • coarse grains • d50 = 3.96 mm Each of the bed-load mixtures was fed into the flume at ‘low’ and ‘high’ feed rates (0.003 & 0.006 kg/m/s, experiments 1 & 2 respectively)
Plane Bed with Gravel RoughnessNormalised Reynolds Shear Stress • linear trend validates 2D flow assumption • deviation in near-bed region due to roughness layer • thickness of roughness layer increases with increasing feed sediment size (~1 mm thicker with each size increment) • slight deviation towards free-surface attributed to wall effects (aspect ratio = 4.5)
Plane Bed with Gravel RoughnessDouble-Averaged Streamwise Velocity Effect of bed load size • all profiles obey logarithmic distribution • presence of bed-load sediment results in lower velocities at level z, consistent with greater roughness heights • degree of retardation depends on sediment size (coarser grains cause more slowing) • obvious exception is experiment ‘Fine 2’ . . . .
Plane Bed with Gravel RoughnessDouble-Averaged Streamwise Velocity Effect of feed rate • experiments ‘clear 1’ and ‘clear 2’ show excellent agreement, indicating the repeatability of the PIV process • feeding more fine particles reverses the velocity shift – effectively smoothing the bed and permitting higher velocities • negligible effect of feed rate with medium grains • conversely, coarse particles increase bed-roughening at the higher feed rate, causing a further downwards shift in velocity profile
Plane Bed with Gravel RoughnessForm-Induced Stress Profiles • form-induced stress peaks in the roughness layer where the difference between time- and double-averaged quantities is maximised • for clear water cases, the form-induced stress constitutes up to 35% of the maximum Reynolds stress (much higher than previously anticipated) • although reduced from the clear water value for all bed-load cases, the form-induced stres still contributed around 15% of the total shear in the roughness layer
Conclusions • Spatial averaging methodology provides new insight into the characteristics of turbulent flow near a rough bed • Spatial fluctuations in the flow velocity are strongly influenced by the spacing and the shape of the roughness elements • Over various types of roughness, with and without bed-load transport, the recorded levels of form-induced stress are quite high (up to 30% of the total shear in the roughness layer) • PIV is very well suited to assessing the spatial averaging technique