Mastering Weather Maps: Understanding Forecasts & Satellite Tracking
Explore meteorology, weather instruments, isobars, El Niño, La Niña, and satellite technology for effective weather interpretation and forecasting.

Mastering Weather Maps: Understanding Forecasts & Satellite Tracking
E N D
Presentation Transcript
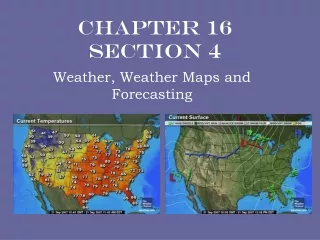
Chapter 16 Section 4 Weather, Weather Maps and Forecasting
A. Weather • 1. Weather: The daily conditions of a particular area: temp, rain, pressure, wind, etc. • 2. Climate- average conditions of an area over time. • 3. Weather Forecast- A prediction about future weather conditions based on weather data. • 4. Meteorologist: A scientist who studies the weather and brings us the weather forecast, like you see on the news. They use information they gather from many sources to predict the weather. • 5. Meteorology- the science of studying weather
B. Weather Forecasting Technology • 1. Weather Balloon: Carry electronic equipment that can measure weather conditions as high as 30 km above the Earth’s surface. They measure temperature, air pressure and relative humidity. They can also measure wind speed and direction. • 2. Thermometer: Measures temperature • 3. Barometer: Measures air pressure • 4. Psychrometer: An instrument used for measuring the water vapor content of the atmosphere. • 5.Windsock: Cone shaped cloth bag that measures wind direction
6. Anemometer- Measure wind speed • 7. Radar- Finds location, movement and amount of precipitation. Can also predict kind of precipitation 8.Doppler Radar is used by local T.V. stations to track precipitation. • 9. Weather Satellite Orbit Earth and provide images of weather systems.
Weather Instruments Thermometer Doppler Radar Anemometer Barometer Weather Satellite Wind Sock
Satellites in Space • Satellites are tracked by United States Space Surveillance Network (SSN), which has been tracking every object in orbit over 10 cm (3.937 inches) in diameter since it was founded in 1957. • There are approximately 3,000 satellites operating in Earth orbit, according to the US National Aeronautics and Space Administration (NASA), out of roughly 8,000 man-made objects in total. • In its entire history, the SSN has tracked more than 24,500 space objects orbiting Earth. The majority of these have fallen into unstable orbits and incinerated during reentry. • The SSN also keeps track which piece of space junk belongs to which country
C. Weather Map 1. A weather map can show many different things. • Temperature • High Pressure (clear) • Low Pressure (cloudy) • Isobars • Rain/Snow • Fog • Warm Front • Cold Front • Severe Weather- Hurricanes
D. ISOBARS 1. An isobar is a line connecting locations of equal barometric pressure. Certain weather maps allow us to view High and Low pressure systems that control the weather. Isobar maps show where pressures are relatively high and low, and show us where pressure changes are gradual or dramatic over a distance.
ISOBARS- Certain weather maps allow us to view High and Low pressure systems that control the weather. An isobar is a line connecting locations of equal barometric pressure. Isobar maps show where pressures are relatively high and low, and show us where pressure changes are gradual or dramatic over a distance.
Weather Map Symbols High Pressure Clear Weather Cold Front Warm Front Low Pressure Cloudy Weather Occluded Front Isobars: Show equal Lines of Pressure. Stationary Front
El Nino Winters, during the El Niño effect, are warmer and drier than average in the Northwest, northern Midwest, and northern Mideast United States, so those regions experience reduced snowfalls. Meanwhile, significantly wetter winters are present in northwest Mexico and the southwest United States, including central and southern California, while both cooler and wetter than average winters in northeast Mexico and the southeast United States.
La Nina La Niña causes mostly the opposite effects of El Niño, above-average precipitation across the northern Midwest, the northern Rockies, Northern California, and the Pacific Northwest's southern and eastern regions. Meanwhile, precipitation in the southwestern and southeastern states is below average.[7] This also allows for the development of many stronger-than-average hurricanes in the Atlantic and less in the Pacific.
Terms to know: 1.Upwelling-the rising of deeper colder ocean water to shallower depths 2. El Nino- an abnormal warming of surface ocean waters in the Pacific Ocean 3. La Nina-characterized by unusually cold ocean temperatures in the Pacific Ocean 4. Low Pressure- cloudy weather. A hurricane is an area of low pressure 5. High Pressure- clear weather
National Weather Service (NWS) • From the NWS website you can view any kind of weather related information. • You can even see river stages and air quality.