Neural Networks Primer
350 likes | 480 Vues
This primer introduces the concept of Artificial Neural Networks (ANNs), outlining their capability to learn various types of functions from data. It highlights the biological analogy to human neurons and discusses how they are interconnected. The document emphasizes the robustness of ANN learning against errors in training data and gives examples of practical applications, including visual scene interpretation and speech recognition. Additionally, it covers topics like network weight adjustments, training sets, and specific learning algorithms through illustrative examples.

Neural Networks Primer
E N D
Presentation Transcript
Neural Networks Primer Dr Bernie Domanski The City University of New York / CSI 2800 Victory Blvd 1N-215 Staten Island, New York 10314 drbernie@optonline.net http://domanski.cs.csi.cuny.edu
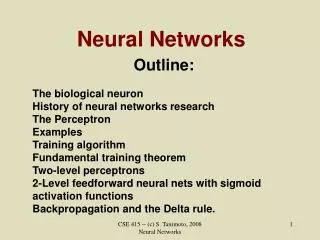
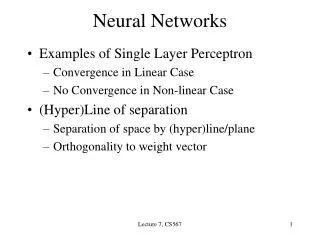
What is a Neural Network? Artificial Neural Networks – (ANN) • Provide a general, practical method for learning • real valued functions • discrete valued functions • vector valued functions from examples • Algorithms “tune” input parameters to best fit a training set of input-output pairs
What is a Neural Network? • ANN Learning is robust to errors in the training set data • ANN have been applied to problems like • Interpreting visual scenes • Speech recognition • Learning robot control strategies • Recoginizing handwriting • Face recognition
Biological Motivation • ANNs are built out of a densely interconnected set of simple units (neurons) • Each neuron takes a number of real-valued inputs • Produces a single real-valued output • Inputs to a neuron may be the outputs of other neurons. • A neuron’s output may be used as input to many other neurons
Biological Analogy Human Brain: 1011 neurons • Each neuron is connected to 104 neurons • Neuron Activity is inhibited or excited through interconnections with other neurons • Neuron switching times = 10-3 (human) • Time to recognize mom = 10-1 seconds • Implies only several hundred neuron firings
Complexity of the Biological System • Speculation: • Highly parallel processes must be operating on representations that are distributed over many neurons. • Human neuron switching speeds are slow • Motivation is for ANN to capture this highly parallel computation based on a distributed representation
A Simple Neural Net Example Weight Output Input Nodes Neurons LINK The Bug Brain
How Does the Network Work? Assign weights to each input-link Multiply each weight by the input value (0 or 1) Sum all the weight-firing input combinations If Sum >Threshold for the Neuron then • Output = +1 • Else Output = -1 So for the X=1, Y=1 case – IF w1*X+w2*Y > 99 THEN OUTPUT =Z= +1 50*1+50*1 > 99 IF w3*X+w4*Y+w5*Z > 59 THEN OUTPUT = +1 30*1+30*1+(-30)*1 > 59 ELSE OUTPUT = -1
100 99 100 OR X Y output 0 0 -1 0 1 1 1 0 1 1 1 1
Exclusive OR W3 30 X Y output 0 0 -1 0 1 1 1 0 1 1 1 -1 W4 30 59 Output -30 X Y Neurons W5 50 99 W2 50 Exclusive-OR W1 LINK
Appropriate Problems for Neural Networks • Instances where there are vectors of many defined features (eg. meaurements) • Output may be a discrete value or a vector of discrete values • Training examples may contain errors • Non-trivial training sets imply non-trivial time for training • Very fast application of the learned network to a subsequent instance • We don’t have to understand the learned function – only the learned rules
How Are ANNs Trained? • Initially • choose small random weights (wi) • Set threshold = 1 • Choose small learning rate(r) • Apply each member of the training set to the neural net model using the training rule to adjust the weights
The Training Rule Explained • Modify the weights(wi) according to the Training Rule: • Here – • r is the learning rate (eg. 0.2) • t = target output • a = actual output • xi=i-th input value wi = wi + wi where wi = r * (t – a) * xi
Training for ‘OR’ Training Set: X1 X2 target 0 0 -1 0 1 1 1 0 1 1 1 1 Initial Random Weights W1 = .3W2 = .7 Learning Rate r = .2
Applying the Training Set for OR - 1 X1 1 a X2 0 0 = -10 1 = -1 X w1 = r * (t – a) * x1 = .2 * (1-(-1)) * x1 = .2 * (2) * 0 = 0 w2 = .2 * (1-(-1)) * x2 = .2 * (2) * 1 = .4 .3 .7 w1 = w1 + w1 = .3 + 0 = .3 w2 = w2 + w2 = .7 +.4 = 1.1
Applying the Training Set for OR - 2 X1 1 a X2 0 0 = -10 1 = +11 0 = -1 X w1 = r * (t – a) * x1 = .2 * (1-(-1)) * x1 = .2 * (2) * 1 = .4 w2 = .2 * (1-(-1)) * x2 = .2 * (2) * 0 = 0 .3 1.1 w1 = w1 + w1 = .3 + .4 = .7 w2 = w2 + w2 = 1.1+0 = 1.1
Applying the Training Set for OR - 3 X1 1 a X2 0 0 = -10 1 = +11 0 = -1 X w1 = r * (t – a) * x1 = .2 * (1-(-1)) * x1 = .2 * (2) * 1 = .4 w2 = .2 * (1-(-1)) * x2 = .2 * (2) * 0 = 0 .7 1.1 w1 = w1 + w1 = .7+.4 = 1.1 w2 = w2 + w2 = 1.1+0 = 1.1
Applying the Training Set for OR - 4 X1 1 a X2 0 0 = -10 1 = +11 0 = +11 1 = +1 1.1 1.1
Training for ‘AND’ Training Set: X1 X2 target 0 0 -1 0 1 -1 1 0 -1 1 1 1 Initial Random Weights W1 = .3W2 = .7 Learning Rate r = .2
Applying the Training Set for AND - 1 X1 1 a X2 0 0 = -10 1 = -11 0 = -11 1 = -1 X w1 = r * (t – a) * x1 = .2 * (1-(-1)) * 1 = .4 w2 = .2 * (1-(-1)) * 1 = .4 .3 .7 w1 = w1 + w1 = .3 + .4 = .7 w2 = w2 + w2 = .7 +.4 = 1.1
Applying the Training Set for AND - 2 X1 1 a X2 0 0 = -10 1 = +1 X w1 = r * (t – a) * x1 = .2 * (-1-(+1)) * 0 = 0 w2 = .2 * (-1-(+1)) * 1 = -.4 .7 1.1 w1 = w1 + w1 = .7 + 0 = .7 w2 = w2 + w2 = 1.1 -.4 = .7
Applying the Training Set for AND - 3 X1 1 a X2 0 0 = -10 1 = -11 0 = -11 1 = +1 .7 .7
Select The Data Set Choose data for the Neugent
Select The Output That You Want to Predict Choose Inputs Identify the Outputs
Train And Validate the Neugent • Choose Action to be performed: • Create the model (Quick Train) • Train & Validate (to understand the predictive capability) • Investigate the data (Export to Excel or Data Analysis)
Validate the Neugent With the Data Set • Selecting Training Data – • Select a random sample percentage • Use the entire data set
Neugent Model is Trained, Tested, and Validated • Training Results – • Model Fit: 99.598%(trained model quality) • Predictive Capability: 99.598%(tested model quality)
View The Results in Excel Consult trained Neugent for prediction Save results using Excel
Data Analysis Stats & Filtering: mean, min, max, std dev, filtering constraints Ranking: input significance Correlation Matrix: corr. between all fields
Correlation Matrix The closer to 1, the stronger the indication that the information represented by the two fields is the same NetBusy vs #Trans = .9966
Summary Neural Networks • Modeled after neurons in the brain • Artificial neurons are simple • Neurons can be trained • Networks of neurons can be taught how to respond to input • Models can be built quickly • Accurate predictions can be made
Questions? • Questions, comments, … ?? • Finding me – • Dr Bernie Domanski • Email: domanski@postbox.csi.cuny.edu • Website: http://domanski.cs.csi.cuny.edu • Phone: (718) 982-2850 Fax: 2356 • Thanks for coming and listening !