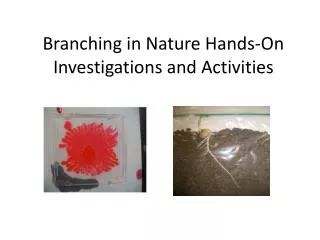
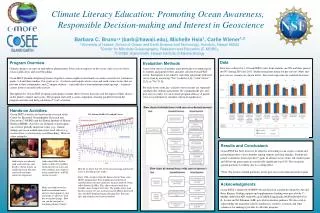
Hands-on Activities
Climate Literacy Education: Promoting Ocean Awareness, Responsible Decision-making and Interest in Geoscience. Barbara C. Bruno 1,2 (barb@hawaii.edu), Michelle Hsia 1 , Carlie Wiener 1,3 1 University of Hawaii, School of Ocean and Earth Science and Technology, Honolulu, Hawaii 96822

Hands-on Activities
E N D
Presentation Transcript
Climate Literacy Education: Promoting Ocean Awareness, Responsible Decision-making and Interest in Geoscience Barbara C. Bruno1,2 (barb@hawaii.edu), Michelle Hsia1, Carlie Wiener1,3 1University of Hawaii, School of Ocean and Earth Science and Technology, Honolulu, Hawaii 96822 2Center for Microbial Oceanography: Research and Education (C-MORE), 3COSEE Island Earth, Hawaii Institute of Marine Biology Program Overview Climate change is not just an atmospheric phenomenon. It has serious impacts on the ocean, such as sea level rise, ocean acidification, and coral bleaching. Ocean FEST (Families Exploring Science Together) science nights feature hands-on science activities for students in grades 3–6 and their families. Our goals are to: (1) educate participants about ocean and earth science issues that are relevant to their communities; and (2) inspire students – especially those from underrepresented groups – to pursue careers in the ocean and earth sciences. Throughout the Ocean FEST program, participants examine their everyday decisions and the impact of their choices on the planet's climate and oceans. The program ends with a career component, drawing parallels between the program activities and daily job duties of “real” scientists. Evaluation Methods A nine-item survey of attitudes and knowledge was administered to students and parents before and after selected Ocean FEST events. Participants were asked to state their agreement with each survey item by answering “Yes” [coded as 2.0], “I don’t know” [1.5], or “No” [1.0]. For each survey item, pre- and post-survey means are separately calculated for students and parents. By comparing the pre- and post-survey results, we can evaluate program efficacy. A paired t-test was performed to calculate statistical significance. Data Data were collected at 13 Ocean FEST events from students (n=596) and their parents (n=597) during 2010 and 2011. Student and parent means for pre-surveys (blue) and post-surveys (orange) are shown below. Error bars represent one standard deviation. Flow chart of attitude items (with correct or desired answers) Hands-on Activities Ocean FEST activities are based on the research of the Center for Microbial Oceanography: Research and Education (C-MORE) and the Hawaii Institute of Marine Biology (HIMB). Activities are designed so participants can see how globally important issues (e.g., climate change and ocean acidification) have local effects (e.g., sea level rise, coastal erosion, coral bleaching). Here are a few examples: The Station ALOHA CO2 and pH Curves Results and Conclusions Ocean FEST has been shown to be effective in teaching ocean science content and promoting positive career attitudes among students and their families. Student and parent evaluations showed positive* gains on all nine survey items. All student gains and all but one parent gain are statistically significant at p<0.05.The exception (parent question 2) is likely due to a ceiling effect. *Note: For reverse-worded questions, lower post-test scores indicate positive gains. Add vinegar to carbonate sand, and watch the sand dissolve. Relate to how an acidifying ocean threatens coral reefs and other calcareous organisms. Add colored Alka Seltzer tablets to form CO2 bubbles, which dissolve in water and form carbonic acid. Segue to ocean acidification, and UH current research. Flow chart of content items (with correct answers) How do we know that CO2 levels are increasing and that the ocean is becoming more acidic? Since 1988, scientists from the Hawaii Ocean Time-series (HOT) program have been making measurements of seawater about once per month at a location north of O‘ahu called Station ALOHA. This allows them to track how variables have changed over time. The graphs above show that the ocean’s CO2 has increased and its pH has decreased since the HOT program began collecting data. For more info: http://hahana.soest.hawaii.edu/hot/ Acknowledgments Ocean FEST is funded by NSF#091431and based on a model developed by Art and Rene Kimura. Staffing support and supplementary funding were provided by C-MORE (NSF-OIA #EF-0424599) and COSEE Island Earth (NSF/OCE#1039352). R. Levine and M. Fuhrman (AIR) provided evaluation guidance. We also wish to acknowledge the numerous school coordinators, teachers, scientists and other volunteers for making it possible to offer this program. Make an island out of clay, build an oceanfront house, and see what happens to your real estate as “glaciers” melt due to climate change. How can you do your part in mitigating climate change?