Download
1 / 10
100 likes | 209 Vues
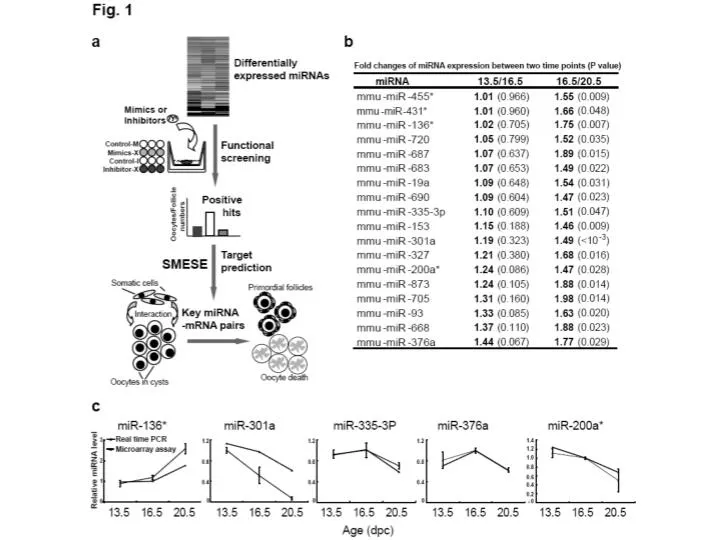
Fig. 1 Screening for miRNAs that regulate primordial follicle assembly in mouse ovaries.

E N D
Fig. 1 Screening for miRNAs that regulate primordial follicle assembly in mouse ovaries. (a) A flow chart of the screening strategy. miRNAs that expressed differentially during primordial follicle assembly were identified by microarray, and subjected to a functional screening for those that regulate primordial follicle assembly by transfection of cultured fetal mouse ovaries with mimics or inhibitors of them individually. The positive hits were then assayed for their functional roles in early folliculogenesis by the prediction of their targets using a bioinformatics tool, SMESE, and identification of the biological processes that the targets are involved in mouse primordial follicle assembly using experimental procedures accordingly. (b) The differentially expressed miRNAs were identified in mouse ovaries between 16.5 and 20.5 dpc (P<0.05), but not between 13.5 and 16.5 dpc (P>0.05). (c) The expression of the five randomly selected miRNAs identified by miRNA microarrays is confirmed by real time PCR analysis in 13.5, 16.5 and 20.5 dpc mouse ovaries. Each bar represents the mean±s.d. of ovaries from three independent experiments in different animals.
Fig. 2 Quantification of oocytes, primordial follicles and primary follicles in cultured 18.5 dpc ovaries four days after transfection with miRNA mimics or inhibitors. The number of oocytes, primordial follicles, and primary follicles per ovary varied in the 18.5 dpc fetal mouse ovaries transfected with different miRNA mimics (a) or inhibitors (b) for 96 hours. Each bar represents the mean±s.d. of ovaries from three to five independent experiments in different animals. For the control, the bar represents the mean±s.d. of all ovaries transfected with miRNA mimic control or inhibitor control from all independent experiments. *: P<0.05, Student's t-test.
Fig. 3 GO and NETWORK assay for miRNA targets predicted by SMESE. (a) Two models with 50 bp flanks were selected to construct the SMESE algorithm, and the increase in the number of parameters used led to better performance (details in Supplementary Table 9). (b) Scatter plot of the true positive rate versus the false positive rate for different target prediction algorithms used to predict an independent test dataset. The SMESE method showed better performance than other methods. (c) The targeted genes for the ten miRNAs identified from our functional screening (shown in Fig. 2) were predicted by SMESE, and were analyzed by GO analysis. The identified biological processes, in which the potential target genes are involved, were ranked based on the gene enrichment ratio. Group S, a group that includes all targeted genes predicted by SMESE for the ten miRNAs; Group W, a group that includes whole mouse transcripts. Enrichment ratio is calculated as the percentage of proteins annotated in group S divided by the percentage of proteins in group W. (d) The network interaction of the mouse targets predicted by SMESE for the ten miRNAs were mapped by STRING and the top 5 cellular processes in which these targets are over-represented (the enrichment ratio more than 1) were highlighted. Colored node: Proteins; Gray line: interaction. Cdh2 and Caspase-2, key regulators in cell adhesion and apoptosis, respectively.
Fig. 4 miR-200a* and Cdh2 are involved in the estrogen-induced suppression of primordial follicle assembly. (a) Cdh2 protein and (b) mRNA levels were determined by immunoblotting and real time PCR assays in 18.5 dpc ovaries transfected with miR-200a* mimics for 96 hours, respectively. (c) miR-200a* directly targets the 3’ UTR of Cdh2 mRNAs. The DNA fragment (~300 bp) encoding the 3’ UTR of Cdh2 mRNA that contains the predicted wild-type or mutant miR-200a* binding site was cloned downstream of the Renilla luciferase ORF in the psiCHECK-2 vector. Relative luciferase activity was assayed following co-transfection of miR-200a* mimics with the constructs encoding wild-type or mutant miR-200a* binding site into 293T cells. (d) The expression of miR-200a* increased strikingly with the extension of estrogen treatment in cultured 18.5 dpc ovaries, accompanied with the decrease of Cdh2 mRNA level. (e) Immunoblotting for Cdh2, Vimentin, and Cdh1 was carried out in 18.5 dpc ovaries treated with estrogen for 96 hours. (f) Quantification of primordial and primary follicles in the control and estrogen treated, miR-200a* mimics transfected, Cdh2 siRNAs transfected ovaries. For vehicle control, the cultured 18.5 dpc ovaries were exposed daily to DMSO alone. (g) The mRNA expression of Cdh2 was partially recovered after the transfection of miR-200a* inhibitors when the cultured 18.5 dpc ovaries were exposed daily to estrogen (10-8 M). (h) The decreased number of primordial follicles caused by estrogen treatment (10-8 M) was partially recovered after the transfection of miR-200a* inhibitors in cultured 18.5 dpc ovaries. For vehicle control, the cultured 18.5 dpc ovaries were exposed daily to DMSO alone. Each bar represents the mean±s.d. of ovaries from three independent experiments in different animals. *: P<0.05, Student's t-test.
153 ormiR-153,必须统一。 • e图不能说明我们想说的问题,能否量化带的深浅?
Fig. 5 miR-153 regulates primordial follicle assembly mediated by down-regulation of oocyte apoptosis process by targeting Casp2. (a) Caspase-2 protein and (b) mRNA levels were determined by immunoblotting and real time PCR assays in cultured 18.5 dpc ovaries transfected with miR-153 mimics for 96 hours. (c) miR-153 directly targets the 3’ UTR of Casp2 mRNAs. The DNA fragment (~300 bp) encoding the 3’ UTR of Casp2 mRNA that contains the predicted wild-type or mutant miR-153 binding site was cloned downstream of the Renilla luciferase ORF in the psiCHECK-2 vector. Relative luciferase activity was assayed following co-transfection of miR-153 mimics with the constructs encoding the wild-type or mutant miR-153 binding site into 293T cells. (d) Quantification of oocytes, primordial and primary follicles in ovaries transfected with miR-153 mimics and/or Casp2 siRNAs for 96 hours. For vehicle control, the cultured 18.5 dpc ovaries were exposed daily to DMSO alone. (e) The levels of uncleaved Caspase-3 in oocytes was detected by immunoblotting in 18.5 dpc fetal mouse ovaries transfected with miR-153 mimics and Casp2 siRNAs alone, or both of them together for 96 hours. Each bar represents the mean±s.d. from three independent experiments in different animals.*: P<0.05, Student's t-test.