Fig. 1
AN INVESTIGATION ON THE FACTORS INFLUENCING THE RURAL SURFACE OZONE LEVELS IN THE EASTERN MEDITERRANEAN (MALTA, GREECE, CYPRUS) P. D. Kalabokas (1), R. Ellul (2), E. Gerasopoulos (3), N. Mihalopoulos (3), S. Kleanthous (4) and C. C. Repapis (1)


Fig. 1
E N D
Presentation Transcript
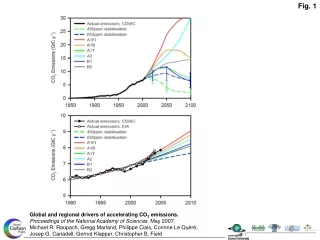
AN INVESTIGATION ON THE FACTORS INFLUENCING THE RURAL SURFACE OZONE LEVELS IN THE EASTERN MEDITERRANEAN (MALTA, GREECE, CYPRUS) P. D. Kalabokas (1), R. Ellul (2), E. Gerasopoulos (3), N. Mihalopoulos (3), S. Kleanthous (4) and C. C. Repapis (1) (1) Academy of Athens, Research Center for Atmospheric Physics and Climatology, Athens, Greece (2) Department of Physics, University of Malta, Malta (3) Environmental Chemical Processes Laboratory, Department of Chemisty, University of Crete, Heraklion, Greece (4) Ministry of Labor and Social Insurance, Labor Department, Nicosia, Cyprus Abstract An investigation on the origins of the observed variations in the Eastern Mediterranean summer (JJA) rural surface ozone is performed, following observations showing comparable ozone levels between Central Greece and the Crete Island, being by 15-20% higher than the corresponding levels in Malta and Cyprus (Fig. 1, Tab. 1). For this purpose the measurements of the first 3-year period (1998-2000) of the common operation of the following four Eastern Mediterranean stations are analyzed: Giordan Lighthouse-Gozo, Malta; Aliartos-Central Greece, Finokalia-Crete, Greece and Ag. Marina, Cyprus. All the above stations experience, in principle, similar weather conditions during summer regarding the high temperatures and the strong solar irradiation. For obtaining representative boundary layer air the mid-day ozone averages (12:00 – 18:00) were used.
Gozo, Malta Gozo, Malta Gozo, Malta Gozo, Malta Finokalia, Crete Finokalia, Crete Finokalia, Crete Finokalia, Crete Aliartos, Cent-Greece Aliartos, Cent-Greece Ag. Marina, Cyprus Ag. Marina, Cyprus Ag. Marina, Cyprus Ag. Marina, Cyprus Average 55.310.1 62.28.0 54.17.6 90th Percentile Average 67.9 51.79.5 65.28.4 71.8 62.85.6 62.6 56.06.7 90th Percentile 62.4 75.9 69.5 63.4 7 % highest 73.65.0 76.53.2 65.73.3 80th Percentile 20% highest 64.74.5 63.2 75.83.9 68.4 70.62.6 60.0 63.91.8 80th Percentile 60.0 71.7 67.9 61.8 7 % lowest 35.93.2 46.33.9 38.16.0 20% lowest 50th Percentile 39.23.4 55.9 54.36.3 62.8 55.02.4 55.0 45.64.2 50th Percentile 49.9 64.8 62.5 57.2 20th Percentile 46.4 55.9 48.1 20th Percentile 43.4 60.1 58.8 51.6 10th Percentile 42.5 52.4 44.7 10th Percentile 39.5 55.8 55.4 46.0 Tab. 1a (left up)Distribution statistics of the rural summer (JJA) afternoon ozone measurements in the Eastern Mediterranean for the year 1998. Tab1b (right up)Average values of the rural summer (JJA) afternoon ozone measurements in the Eastern Mediterranean stations for the year 1998: a). Total averages b). Average ozone value of the 20% of the days with the highest values and c). Average ozone value of the 20% of the days with the lowest values. Tab 1c (left down)Distribution statistics of the rural summer (JJA) afternoon ozone measurements in the Eastern Mediterranean for the years 1998, 1999 and 2000. Tab 1d (right down)Average values of the rural summer (JJA) afternoon ozone measurements in the Eastern Mediterranean stations for the years 1998, 1999 and 2000: a). Total averages b). Average ozone value of the 7% of the days with the highest values and c). Average ozone value of the 7% of the days with the lowest values.
Fig. 2a (left) Composite weather map of geopotential heights at 850 hPa (lower panel, isopleths of 10m), and 700 hPa (upper panel, isopleths of 10m) of the 7% of the days (20 days) with the highest ozone values (12:00 – 18:00) in Gozo, Malta in the summers (JJA) of 1998-2000. Fig. 2b (right) Composite weather map of geopotential heights at 850 hPa (lower panel, isopleths of 10m), and 700 hPa (upper panel, isopleths of 15m) of the 7% of the days (20 days) with the lowest ozone values (12:00 – 18:00) in Gozo, Malta in the summers (JJA) of 1998-2000.
Fig. 3a (left): Composite weather map of geopotential heights at 850 hPa (lower panel, isopleths of 10m), and 700 hPa (upper panel, isopleths of 15m) of the 7% of the days (18 days) with the highest ozone values (12:00 – 18:00) in Finokalia, Crete, in the summers (JJA) of 1998-2000. Fig. 3b (right):Composite weather map of geopotential heights at 850 hPa (lower panel, isopleths of 10m), and 700 hPa (upper panel, isopleths of 15m) of the 7% of the days (18 days) with the lowest ozone values (12:00 – 18:00) in Finokalia, Crete in the summers (JJA) of 1998-2000.
Fig. 4a (left): Composite weather map of geopotential heights at 850 hPa (lower panel, isopleths of 10m), and 700 hPa (upper panel, isopleths of 15m) of the 7% of the days (19 days) with the highest ozone values (12:00 – 18:00) in Ag. Marina, Cyprus, in the summers (JJA) of 1998-2000. Fig. 4b (right):Composite weather map of geopotential heights at 850 hPa (lower panel, isopleths of 5m), and 700 hPa (upper panel, isopleths of 10m) of the 7% of the days (19 days) with the lowest ozone values (12:00 – 18:00) in Ag. Marina, Cyprus, in the summers (JJA) of 1998-2000
Fig. 5a (left): Average composite weather map of geopotential heights at 850 hPa (isopleths of 10m), for the summers (JJA) of 1998, 1999 and 2000 Fig. 5b (right):Average summer (JJA) absolute (blue in ppb) and relative (brown in %) ozone difference between Heraklion and Vienna in 1996-1997 (18 profiles), (Kalabokas et al., EGU 2004). REFERENCES Cyprus report (2000), “Air quality measurements in Nicosia” (in Greek), Ministry of Labor and Social Insurance, Labor Department, Nicosia, Cyprus. Ellul R. and Nolle M. (2003), Long term trends of trace gas concentrations in the Central Mediterranean as measured at the GAW station on the Island of Gozo, TOR-2 (EUROTRAC-2) Final report, GSF, Munich, Germany. Kalabokas P.D., Viras L. G., Bartzis J. G. and Repapis C.C. (2000), Mediterranean rural ozone characteristics around the urban area of Athens. Atmos. Environ., 34, 5199-5208. Kalabokas P. D. and Repapis C.C. (2004), A climatological study of rural surface ozone in central Greece. Atmos. Chem. and Phys., 4, 1139-1147. P. D. Kalabokas, A. Volz-Thomas, J.-P. Cammas, V. Thouret and C. C. Repapis (2004), Comparison of vertical tropospheric summertime ozone measurements over the Aegean sea and central Europe, European Geosciences Union (EGU), 1st General Assembly, Nice, France, 25-30 April 2004 Kalabokas P.D., G. Kouvarakis, N. Mihalopoulos, R. Ellul, S. Kleanthous and C. C. Repapis (2005). Rural surface ozone levels in the Eastern Mediterranean (Malta, Greece, Cyprus), EGU-General Assembly 2005, Vienna, Austria, 24-29 April 2005 Kouvarakis G., Tsigaridis, K., Kanakidou, M. and Mihalopoulos, N. (2000), Temporal variations of surface regional background ozone over Crete Island in the southeast Mediterranean., J. Geoph. Res., 105, D4, 4399-4407. Kouvarakis G., Vrekoussis, M., Mihalopoulos, N., Kourtidis, K., Rappenglueck, B., Gerasopoulos E., and Zerefos, C. (2002), Spatial and temporal variability of tropospheric ozone in the boundary layer above the Aegean Sea. J. Geoph. Res., 107(D18), 8137, doi:10.1029/2000JD000081,. Nolle M, Ellul R., Heinrich G. and Gusten H. (2002), A long-term study of background ozone concentrations in the Central Mediterranean-Diurnal and seasonal variations on the island of Gozo, Atmos. Environ., 36, 1391-1402. Volz-Thomas A. et al. (2003), Tropospheric ozone and its control, In Synthesis and Integration Report, EUROTRAC-2, GSF, Munich, Germany.
CONCLUSION The data-analysis is mainly based on the classification and grouping of meteorological conditions for the highest and the lowest ozone days (the 7% for each case), for the stations of Malta, Crete and Cyprus by plotting the corresponding NCAR/NCEP average weather maps (Figs. 2-4). It comes out that a main factor leading to high tropospheric ozone values in the area is an anticyclonic influence. When a high pressure system prevails in summer over the area of a station it is expected to create low dispersion conditions in the boundary layer and also induce northerly atmospheric flow advecting southwards air masses affected from the pollutant emissions of Western, Central or Eastern Europe, under favorable summer conditions for photochemical ozone production. These ozone amounts are added up in an already high ozone background throughout the troposphere associated with summer anticyclones. On the other hand, the lowest ozone levels, particularly in Crete and Cyprus stations, are associated with an extension to the west of the Middle-East low and weak pressure gradients over the Eastern Mediterranean and an upper air trough in the North Eastern Europe. The presence of low-pressure systems (poor in tropospheric ozone) is associated with uplifting air movements and consequently high pollutant dispersion conditions and also with westerly (cleaner) atmospheric airflows. In addition, the lowest ozone levels in Malta are associated with a southwards retreat of the North African high pressure system giving way to westerly flow in Western Mediterranean. The high frequency of the above-described meteorological situation influencing surface ozone in Eastern Mediterranean in summer is depicted on the average summer composite weather maps for the period 1998-2000 at the 850hPa (Fig. 5a). The above findings are strengthened if the results of a parallel study on summer vertical tropospheric ozone profiles in the framework of the MOZAIC project are taken into account, as a difference between the Aegean and Central European ozone average values, at all standard pressure levels in the troposphere, was observed which was maximized at the lower levels, 1000 hPa (1000-950) and 900 hPa (950-850), (Fig. 5b). The observed higher ozone differences in the Aegean boundary layer in combination with the strong and persistent northerly flow and the absence of important local ozone precursor emissions is an indication of ozone photochemical production associated with long-range transport, processes significantly enhanced under anticyclonic conditions.