FIG.1
FIG.1 . FIG.2. FIG.3. Fig.4. Fig.5. Fig.6. Fig.7. Fig.8. Fig.10. Fig 9. Fig.12. Fig.11. Fig.14 (LT KID). Fig.13 (RT KID). Fig.16 (axial). Fig.15 (coronal). Fig. 17. Tabte 1. Diagnostic Criteria for Tuberous Sclerosis Complex Major features
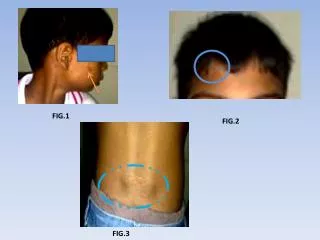

FIG.1
E N D
Presentation Transcript
FIG.1 FIG.2 FIG.3
Fig.4 Fig.5 Fig.6 Fig.7 Fig.8
Fig.10 Fig 9 Fig.12 Fig.11
Fig.14 (LT KID) Fig.13 (RT KID)
Fig.16 (axial) Fig.15 (coronal)
Tabte 1. Diagnostic Criteria for Tuberous Sclerosis Complex • Major features • Facial angiofibromas or forehead plaque • Nontraumaticungual or periungualfibroma • Hvpomelanoticmacules (more than three) • Shagreen patch (connective tissue nevus) • Cortical tuber • Subependymal nodule • Subependymal giant cell astrocytoma • Multiple retinal nodular hamartomas • Cardiac rhabdomyoma, single or multiple • Lymphangiomyomatosis • Renal angiomyolipoma
Minor features • Multiple randomly distributed pits in dental enamel • Hamartomatous rectal polyps • Bone cysts • Cerebral white matter "migration tracts" • Gingival fibromas • Nonrenalhamartoma • Retinal achromic patch • "Confetti" skin lesions • Multiple renal cysts
Legends • Fig.1 Show hyperpigmented lesion on the cheek and raised from the skin surface-Adenoma sebaceum • Fig.2 Show depigmented lesions on the forehead-Ash leaf spots. • Fig.3 Show light yellow colored thickened nodules at the lower back-- Shagreen patches • Fig.4 T2WI axial sequence of brain show multiple small hypointense nodular lesions along the ependymal surface of both the lateral ventricles • Fig.5 On T1WI axial sequences the lesions appears isointense. • Fig.6 On T2WFFE axial sequences the lesions show some blooming • Fig.7 NCCT brain axial sequence shows calcification in few of the leisons.
Fig.8 Post contrast T1WI sequences showed moderate to avid enhancement of the nodular lesions. • Figs.9,10,11 and 12 T2WI axial and FLAIR axial sequences show multiple ill defined scattered areas of increased signal intensity in the cortical and subcortical locations of bilateral cerebral hemispheres. • Fig.13 and 14 USG using high freequency (7-11 Mhz) linear probe shows multiple small anechoic cysts in both the kidneys in the cortical location • Fig.15 and 16 MRI of the abdomen using BFFE coronal and T2W_RT SPIR axial sequences shows small hyperintense cystic lesions in both the kidneys. • Fig.17 USG of right eye using high freequency (7-11 Mhz) linear probe shows a curvilinear echogenic focus in the vitreous chamber along the posterior coat-probably retinal hamartoma.