Graphing SAT Score Trends (1997-2003)
Explore the average SAT math scores from 1997 to 2003 and graph them based on the years since 1997. Learn to scale axes properly, plot points, and interpret the graph correctly.

Graphing SAT Score Trends (1997-2003)
E N D
Presentation Transcript
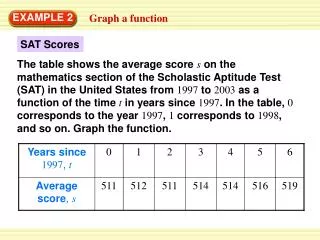
Years since1997,t 0 1 2 3 4 5 6 Average score, s 511 512 511 514 514 516 519 EXAMPLE 2 Graph a function SAT Scores The table shows the average score s on the mathematics section of the Scholastic Aptitude Test (SAT) in the United States from 1997 to 2003 as a function of the time t in years since 1997. In the table, 0 corresponds to the year 1997, 1 corresponds to 1998, and so on. Graph the function.
EXAMPLE 2 Graph a function SOLUTION STEP1 Choose a scale. The scale should allow you to plot all the points on a graph that is a reasonable size. The t-values range from 0 to 6, so label the t-axis from 0 to 6 in increments of 1 unit. The s-values range from511to519, so label the s-axis from510 to520in increments of2units.
EXAMPLE 2 Graph a function STEP2 Plot the points.
WHAT IF?In Example 2, suppose that you use a scale on the s-axis from 0 to 520 in increments of 1 unit. Describe the appearance of the graph. 2. ANSWER The graph would be very large with all the points near the top of the graph. EXAMPLE 2 for Example 2 GUIDED PRACTICE