I2E Data Sets
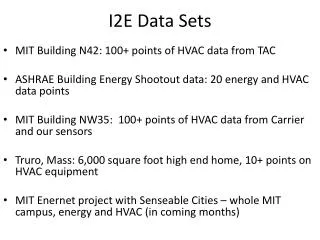
I2E Data Sets. MIT Building N42: 100+ points of HVAC data from TAC ASHRAE Building Energy Shootout data: 20 energy and HVAC data points MIT Building NW35: 100+ points of HVAC data from Carrier and our sensors Truro, Mass: 6,000 square foot high end home, 10+ points on HVAC equipment

I2E Data Sets
E N D
Presentation Transcript
I2E Data Sets • MIT Building N42: 100+ points of HVAC data from TAC • ASHRAE Building Energy Shootout data: 20 energy and HVAC data points • MIT Building NW35: 100+ points of HVAC data from Carrier and our sensors • Truro, Mass: 6,000 square foot high end home, 10+ points on HVAC equipment • MIT Enernet project with Senseable Cities – whole MIT campus, energy and HVAC (in coming months)
I2E Initial Data Results MIT Bldg. N42 Air conditioning turns on 5 hours before occupancy 10 MW-hrs wasted this summer in early start HVAC. Faulty early starts are 4% of annual energy Early start HVAC also ignores the utility of cool outdoor air
I2E Initial Data Results Residence, Truro, Ma. TairSup TairRet “Weekend” house fully operational on weekdays AHU Competing heating and cooling systems TwaterSup TwaterRet Cycling of the unit GSHP Data reveals natural system response.
I2E BT Activities • Data inference: statistical learning for appliance fault detection and opportunity identification • Interactive web portal for viewing energy data and marketing our project: i2e.mit.edu • “Geek Boxes” sensors, box, and support for deploying data system at MIT and beyond • Data acquisition infrastructure: software to gather data and perform systems integration
I2E BT Going Forward • Near term (6 months): • Stand-alone Matlab system for identifying and quantifying energy efficiency opportunities (inference and rules) • Fully featured website for viewing building energy data • Software for data collection • “Geek Box” deployment at MIT, and integrate with MIT PI and TAC databases • Midterm (6-12 months): • Pick up data sources outside of MIT: • ANL • San Cugat • ???
Intelligent Infrastructure for Energy Efficiency:Combining smarts with service S. Samouhos I2E Workshop March 10th, 2009
The Pain Within Buildings Energy Costs Operations Headaches “Fire-fighting” action Too many immediate problems Too much data to review Too few resources to plan ahead
The Problem With Buildings We should fix them We can fix them But we don’t fix them? Why? WE NEED RESOURCES Data Action Identify Opportunities Quantify Opportunities Sell Opportunities Information
I2E Today: Data, Inference, Service Data Acquisition Service Execution DataInference Opportunity • Identify • Quantify • Inform • Malfunction • Create Data • Present Opportunity • Review • Take Action • Fix Buildings
I2E Inference will Answer: • “Is your machine/building running today like it did yesterday?” • “Which of your buildings should we target first for energy efficiency renovations?” • “Which appliance in your building should we fix first?” • “Does your building exhibit and any pathological energy in-efficiency behaviors?” • “Is your building/appliance worth fixing?”
Data Inference Models Expert Rules for e.g. • HVAC left on • HVAC competing • HVAC over-working AI for • Performance changes • Relative comparisons Building Energy Intelligence
AI Techniques for I2E – slide in progress • Classification Trees • Multivariate Process Control • RLS Classifier • Support Vector Machines – today’s weapon of choice • Neural Networks
SVMs X2 +1 • Optimization Problem • Training Error vs. Model Complexity • Accuracy vs. Generalization -1 X1
Test System: Truro, MA • 2200 CFM Geothermal Heat Pump • Measure temperatures and air handler status • 28 Days of data, measured at one minute intervals
Test System Data Transient heating Constant EAT Variable EWT Reverse Cycling Status Flutter
Test System Data System Lag Thermal Lag Non-unique Mapping
Analysis Approach • Separate transient and steady state behavior • Frequency space (machine cycle period) • Run chart (DTair vs. DTwater) • Create run-chart training data • Identify “correct” operation: weighted balance of • Observation frequency (relative counts) • Observation sequence (sequential counts) • Observation periodicity (absolute timing)
Fault Detection: 28 Days • Total series classification • Successful fault detection • Polynomial kernel function • 725 data points • 8 Support Vectors • 5 minutes computation time Heat Pump Performance Classifier 30 Successfully classified correct operation DTair (F) 15 Screened False Positives Successfully classified faulty operation 4 0 8 DTwater (F)
Applications • Integrate with Smart Grid to identify energy efficiency opportunities from AMI • Integrate with TAC and Carrier controls systems to scale into large commercial building stock • Web services to communicate efficiency opportunities to mechanical service contractors nationwide
Immediate Next Steps • Classify on different time periods (days, weeks, etc) • Classify on frequency space (transient behavior analysis) • Matlab GUI for rapid model building/testing, and expert logic implementation • Explore other model techniques: RLS, Trees, MPC