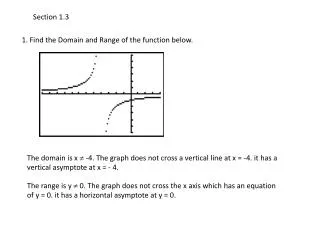
Section 1.3 Linear Function
Section 1.3 Linear Function. Last section we discussed average rate of change over a certain interval When a function has a constant rate of change (i.e. the same average rate of change over all intervals) it’s graph is a line and we call it linear.

Section 1.3 Linear Function
E N D
Presentation Transcript
Last section we discussed average rate of change over a certain interval • When a function has a constant rate of change (i.e. the same average rate of change over all intervals) it’s graph is a line and we call it linear
Consider a car going 25 miles per hour and we get the following table Where t is time in hours and D is distance in miles • What is the average rate of change for each interval? • Find a formula for D as a function of t • What form are linear functions in?
Form of a linear function • For our example we had D = 25t • Linear functions are most commonly written as y = b + mx or y = mx + b where m is the slope and b is the y-intercept where and b gives the value for x = 0 • In general output = rate of change x input + initial value
Do the following problem in your groups • Suppose we know the population of a city is 23,000 in 1982 and 21,000 in 1986 • Assuming the population has been declining at a constant rate since 1970, find a formula for the population as a function of time, t • Let t be the number of years since 1970 (i.e. t = 0 corresponds to the year 1970) • Use your model to determine the population in the year 2000 • When will the population be 0 • Be prepared to present your solution to the class
Do the following problem in your groups • The profit, in dollars, of selling n items is given by P(n) = 0.98n – 3000 • Identify the vertical intercept and the slope • Explain their meanings in practical terms
Do the following problem in your groups • A hotel finds that if it spends no money on renovations, they will be able to rent 100 rooms per night • They find that for every $5000 spent on renovation, they will be able to rent an additional 25 rooms • If x is the amount of money they spend and y is the number of rooms, find a formula for y as a function of x