Sustainable Energy Options:
440 likes | 607 Vues
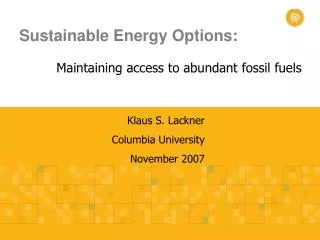
Sustainable Energy Options:. Maintaining access to abundant fossil fuels. Klaus S. Lackner Columbia University November 2007. Norway. USA. Russia. France. UK. China. Brazil. India. $0.38/kWh (primary). Energy, Wealth, Economic Growth. EIA Data 2002.

Sustainable Energy Options:
E N D
Presentation Transcript
Sustainable Energy Options: Maintaining access to abundant fossil fuels Klaus S. Lackner Columbia University November 2007
Norway USA Russia France UK China Brazil India $0.38/kWh (primary) Energy, Wealth, Economic Growth EIA Data 2002
Closing the Gap Plus Population Growth 1% energy intensity reduction Constant per capita growth 1.5% energy intensity reduction 2.0% energy intensity reduction
Lifting Cost Carbon as a Low-Cost Source of Energy US1990$ per barrel of oil equivalent Cumulative Carbon Consumption as of1997 Cumulative Gt of Carbon Consumed H.H. Rogner, 1997
Fossil fuels are fungible Coal Carbon Heat Diesel Shale Refining Electricity Jet Fuel Synthesis Gas Tar Ethanol Oil Methanol Natural Gas DME Hydrogen
The Challenge: Holding the Stock of CO2 constant Extension of Historic Growth Rates Constant emissions at 2010 rate 560 ppm 33% of 2010 rate 10% of 2010 rate 0% of 2010 rate 280 ppm
The Challenge: Holding the Stock of CO2 constant Extension of Historic Growth Rates Constant emissions at 2010 rate 560 ppm 33% of 2010 rate 10% of 2010 rate 0% of 2010 rate 280 ppm
Methane Hydrates 10,000 - 100,000 GtC World Fossil Resource Estimate 8000 GtC 5 1, 2, 3, 4 or 5 times current rate of emission???? 21st century emissions 4 3 2 1 The Mismatch in Carbon Sources and Sinks 1800 - 2000 Fossil Carbon Consumption to date 50% increase in biomass 180ppm increase in the air 30% of the Ocean acidified 30% increase in Soil Carbon
Solar Cost reduction and mass-manufacture Nuclear Cost, waste, safety and security Fossil Energy Zero emission, carbon storage and interconvertibility A Triad of Large Scale Options Markets will drive efficiency, conservation and alternative energy
Hydro-electricity Cheap but limited Biomass Sun and land limited, severe competition with food Wind Stopping the air over Colorado every day? Geothermal Geographically limited Tides, Waves & Ocean Currents Less than human energy generation Small Energy Resources
Net Zero Carbon Economy CO2 from distributed emissions CO2 from concentrated sources Capture from power plants, cement, steel, refineries, etc. Capture from air Permanent & safe disposal Geological Storage Mineral carbonate disposal
Dividing The Fossil Carbon Pie 900 Gt C total Past 10yr 550 ppm
Removing the Carbon Constraint 5000 Gt C total Past
Net Zero Carbon Economy CO2 from distributed emissions CO2 from concentrated sources Capture from power plants, cement, steel, refineries, etc. Capture from air Permanent & safe disposal Geological Storage Mineral carbonate disposal
Slow Leak (0.04%/yr) 2 Gt/yr for 2500 years Storage 5000 Gt of C 200 years at 4 times current rates of emission Current Emissions: 7Gt/year Storage Life Time
Underground Injection statoil
Energy States of Carbon The ground state of carbon is a mineral carbonate Carbon 400 kJ/mole Carbon Dioxide 60...180 kJ/mole Carbonate
Rockville Quarry Mg3Si2O5(OH)4 + 3CO2(g) 3MgCO3 + 2SiO2 +2H2O(l) +63kJ/mol CO2
Bedrock geology GIS datasets – All U.S. (Surface area) 920 km2 8733 km2 Total = 9820 ±100 km2 166 km2
Belvidere Mountain, Vermont Serpentine Tailings
Net Zero Carbon Economy CO2 from distributed emissions CO2 from concentrated sources Capture from power plants, cement, steel, refineries, etc. Capture from air Permanent & safe disposal Geological Storage Mineral carbonate disposal
Flue gas scrubbing MEA, chilled ammonia Oxyfuel Combustion Naturally zero emission Integrated Gasification Combined Cycle Difficult as zero emission AZEP Cycles Mixed Oxide Membranes Fuel Cell Cycles Solid Oxide Membranes Many Different Options
CO2 N2 H2O SOx, NOx and other Pollutants Zero Emission Principle Air Power Plant Carbon Solid Waste
C + O2 CO2 no change in mole volume entropy stays constant G = H 2H2 + O2 2H2O large reduction in mole volume entropy decreases in reactants made up by heat transfer to surroundings G < H Carbon makes a better fuel cell
Proposed Membrane CO2 CO2 Phase I: Solid Oxide CO2 CO2 CO2 O2- O2- O2- O2- PCO2 CO2 CO2 CO2 CO2 CO2 CO2 CO2 CO32- CO32- CO32- CO32- CO2 CO2 CO2 Phase II: Molten Carbonate Multi-Phase Equilibrium CO2 + O2- =CO32-
Net Zero Carbon Economy CO2 extraction from air CO2 from concentrated sources Permanent & safe disposal
Air CO2 CO2 Capture from Air 1 m3of Air 40 moles of gas, 1.16 kg wind speed 6 m/s 0.015 moles of CO2 produced by 10,000 J of gasoline Volumes are drawn to scale
How much wind?(6m/sec) Wind area that carries 10 kW 0.2 m 2 for CO2 80 m 2 for Wind Energy Wind area that carries 22 tons of CO2 per year 50 cents/ton of CO2 for contacting
Air Flow CO2 diffusion Ca(OH)2 as an absorbent Ca(OH)2 solution CaCO3 precipitate CO2 mass transfer is limited by diffusion in air boundary layer
Sorbent Choices 350K 300K Air Power plant
60m by 50m 3kg of CO2 per second 90,000 tons per year 4,000 people or 15,000 cars Would feed EOR for 800 barrels a day. 250,000 units for worldwide CO2 emissions
CO2 CO2 H2 H2 CH2 Materially Closed Energy Cycles O2 O2 Energy Source Energy Consumer H2O H2O
O Oxygen Oxidizer Free O2 CO2 H2O Combustion products Increasing Oxidation State Free C- H CO Town Gas Methanol Fischer Tropsch Synthesis Gas Fuels Biomass Ethanol Coal Petroleum Natural Gas H C Carbon Benzene Methane Hydrogen Gasoline Increasing Hydrogen Content
O Oxygen Oxidizer Free O2 CO2 H2O Combustion products Increasing Oxidation State Free C- H CO Town Gas Methanol Fischer Tropsch Synthesis Gas Fuels Biomass Ethanol Coal Petroleum Natural Gas H C Carbon Benzene Methane Hydrogen Gasoline Increasing Hydrogen Content
O Oxygen Oxidizer Free O2 CO2 H2O Combustion products Increasing Oxidation State Free C- H CO Town Gas Methanol Fischer Tropsch Synthesis Gas Fuels Biomass Ethanol Coal Petroleum Natural Gas H C Carbon Benzene Methane Hydrogen Gasoline Increasing Hydrogen Content
Private Sector Carbon Extraction Farming, Manufacturing, Service, etc. Carbon Sequestration Certified Carbon Accounting Public Institutions and Government guidance Carbon Board certification Permits & Credits certificates