Download
1 / 13
140 likes | 556 Vues
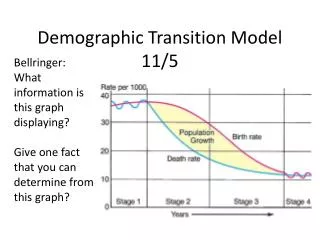
Bellringer : What information is this graph displaying? Give one fact that you can determine from this graph?. Demographic Transition Model 11/5. CASE STUDIES. With your partner, study the demographic transition map, the population pyramid and read the description of your country.

E N D
Bellringer: What information is this graph displaying? Give one fact that you can determine from this graph? Demographic Transition Model11/5
CASE STUDIES • With your partner, study the demographic transition map, the population pyramid and read the description of your country. • Answer the questions in your notebook.
Stages in Classic 4-Stage Demographic Transition Model (DTM) (Some books show a 3-stage model; others mention a new 5th stage)
Stage 1: “Pre-Industrial” Very high birth rates and very high death rates (both about 40) What is NIR? _________ Unreliable food sources: population declines in bad years (famine, diseases) High rates of communicable diseases, war, famine No country or world region still in Stage One
Stage 2: “Early Industrial” High birth rates (over 30) but death rates rapidly declining(to about 20) NIRs very high (pop. explosion); Growth not from increase in births, but from decline in deaths MDCs = starts early 1800s-industrial rev, technology LDCs = starts after 1950s-vaccines, medicine
Why move from Stage 1 to Stage 2? • REMEMBER – the question is…. Why would more people live longer (lower CDR), NOT why would more people be born (higher CBR)?
TRANSITION TO STAGE TWO IN CLASSIC DTM Agricultural technology Improvements in food supply: higher yields as agricultural practices improved in “Second Agricultural Revolution” (18th century) In Europe, food quality improved as new foods introduced from Americas Medical technology Better medical understanding (causes of diseases; how they spread) Public sanitation technologies Improved water supply (safe drinking water) Better sewage treatment, food handling, and general personal hygiene Improvements in public health especially reduced childhood mortality
Stage 3: “Later Industrial” Birth rates decline sharply(to about 15) Death rates decline moderately (to about 10 or less) Moderate NIR MDCs = starts in late 1800s LDCs = starts after 1980s* * Or hasn’t started yet
TRANSITION TO STAGE THREE IN CLASSIC DTM Societies become more urban, less rural Declining childhood death in rural areas (fewer kids needed) Increasing urbanization changes traditional values about having children City living raises cost of having dependents
Stage 4: “Post-Industrial” Birth rates and death rates both low (about 10) NIR very low, zero, or negative MDCs = starts after 1970s LDCs = hasn’t started yet Much of Europe now or soon in population decline as birth rates drop far below replacement level
TRANSITION TO STAGE Four IN CLASSIC DTM Women more influential in childbearing decisions Increasing female literacy changes value placed on motherhood as sole measure of women’s status Women enter work force: life extends beyond family, changes attitude toward childbearing Improved contraceptive technology, availability of birth control But contraceptives not widely avail in 19th century; contributed little to fertility decline in Europe … Fertility decline relates more to change in values than to availability of any specific technology
Which countries are in which stage? WHAT EVIDENCE DO YOU HAVE? • Cape Verde • Chile • Denmark
Why would different countries be able to transition through the DT at different rates?In other words, why does population increase (or decrease) at different rates in different countries?