Download
1 / 9
90 likes | 246 Vues
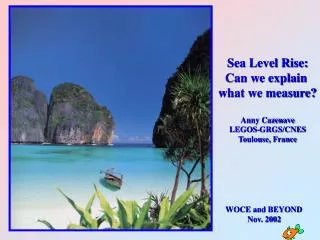
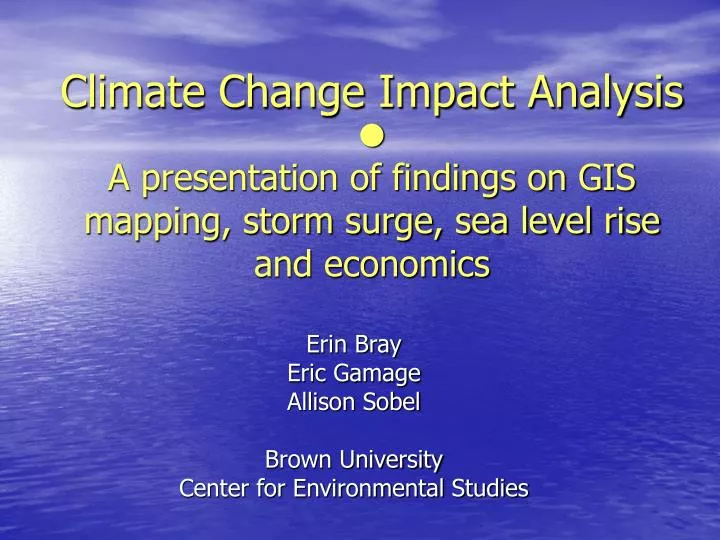
Climate Change Impact Analysis A presentation of findings on GIS mapping, storm surge, sea level rise and economics. Erin Bray Eric Gamage Allison Sobel Brown University Center for Environmental Studies. Sea Level Rise – Case Studies. By 2100 - 5% chance of 29 inches (precautionary).

E N D
Climate Change Impact AnalysisA presentation of findings on GIS mapping, storm surge, sea level rise and economics Erin Bray Eric Gamage Allison Sobel Brown University Center for Environmental Studies
Sea Level Rise – Case Studies By 2100 - 5% chance of 29 inches (precautionary)
Sea Level Rise - Findings • Precautionary principle: • 29 inch rise Rhode Island loses approximately 1,600 acres • Most probable outcome: • 12.4 inch rise Rhode Island loses approximately 604 acres • More examples of losses include: • Narragansett (120 Acres): 4 of commercial property, 10 residential areas, 86 wetlands • Warren (153 Acres): Warren WWTF, several wharves and piers, 14 of wetlands, 58 residential • Charlestown (426 Acres): 44 residential, 132 wetlands, 102 undeveloped land
Storm Surge Impacts: • Hurricane of 1938 (Category 3) • $124 billion in damage in Year 2000 dollars • Storm surges of 10-14 feet • Wind velocities of 120 mph • This was the last 100-year storm to strike Rhode Island If this type of hurricane were to strike Rhode Island now or after a sea level rise, what would be the impacts to the natural and built environment? In order to assess impacts, we have performed case studies of the following for South Kingstown and Providence: Location and Value of Parcels Susceptibility of Soils to Erosion Land Use/Land Cover of affected areas Location of Facilities
Storm Surge: Providence ParcelsInundation by 14-ft floods and 7-ft floods • If the Hurricane of 1938 struck Providence today: • 1,100 acres will be lost • 12% of Providence parcels will be lost (505 parcels) • $484,383,000 ~ total parcel value inundated • $1,429,800 - $3,211,400 range of property values that will be affected more than any other group (GIS)
Economic Impacts of Rhode Island • Sea level Rise from 2000 – 2050 • Category 4 Hurricane “100-year storm” Sea Level Rise (2000-2050) • Loss of Property and Property Value - $510-$679 million • -higher flood insurance premiums • -damage to industrial capital • Infrastructure Damage – roughly $350 million • -Beach replenishment - $300,000 per year • Public Health – $47-$189 million • -mosquito spraying - increases by $158,000 per year • -salinity changes of water likely to affect health of all species TOTAL DAMAGE PREDICTION $849 million To $1.098 billion
Category 4 Hurricane Industrial Losses • Property - $3.66-$9.13b • Block Island, Portsmouth, and Warwick are most vulnerable • Industry - $585.4-$609.8m • Major losses include hotel bookings ($17.4m), marinas ($16.8m), and restaurants ($9.2m) • Infrastructure - $77.2-$105m • Waste Water Treatment Facilities ($25.7m), Roads ($1.64m), Power Lines ($1.11m) • Public Health - $16.3-$25.1m • Loss of life, increased hospital costs, long-term ailments Total - $585.38 million Transportation 5% Retail 18% Tourism 52% Manufacturing 25% TOTAL DAMAGE PREDICTION: $4.36 - $9.89 billion
Policy Recommendations • GIS Mapping and Economic Analyses have shown that coastal areas are at high risk to erosion and inundation due to storm surge and sea level rise. • Adaptive measures to these risks will incur exponential costs over the next century. • Mitigation measures can be taken by: Requiring statewide impact analyses, through GIS and economic data at 5-year intervals so as to update models obtained from RIGIS and the Hadley Centre. Statewide Planning should require that Comprehensive Plans within each coastal town assess risks according to future sea level rise and storm surge impacts and: - compare zoning maps to our sea level rise/storm surge maps - re-zone to restrict future development - downzone areas at risk which are currently zoned for high density
Thank You Education and Outreach Committee, RIGHG Harold Ward Kathleen Esposito Don Pryor Bob Vanderslice, Dept. of Public Health Townsend Goddard Greg Banner Helen Cottrell Jeff Albert & Lynn Carlson Tim Tyrrell Erin_Bray@Brown.edu Eric_Gamage@Brown.edu Allison_Sobel@Brown.edu Please Visit Our Website! http://envstudies.brown.edu/classes/es201/2003/Impact/impactanalysis_index.htm