Global Climate Change
Global Climate Change. Global Climate Change information 1992-93. Researchers at a NSF funded workshop gave their analysis of climate change as it was understood in 92-93. • The change would be slow and gradual with the first


Global Climate Change
E N D
Presentation Transcript
Global Climate Change
Global Climate Change information 1992-93 Researchers at a NSF fundedworkshop gave their analysis of climate change as it was understood in 92-93. • The change would be slow and gradual with the first impacts beginning to be expressed in 2050 • The Arctic and subtropics would first experience change and experience the most severe changes. • The temperate latitudes (US) would be least and last affected. • Change would first be expressed through more severe and frequent droughts, floods, hurricanes and tornados • Migration north of plant and animal species and tropical diseases such as Malaria.
The Greenhouse Effect Solar radiation enters the earth’s atmosphere and much of it is reflected back into the atmosphere Green house gases such as C02, Methane, and water vapor trap much of that reflected heat warming the planet. With out the greenhouse effect the earth’s climate would be much more extreme. The problem is that we are increasing all three major gasses, C02, Methane as well as Water vapor as higher temperatures increase evaporation rates.
Fossil fuel use is the major source of C02. Coal electric plants are one of the major sources of C02 and will be the most difficult to control emissions. It is costly to retrofit the plants to trap carbon. China has vast stores of coal and is bringing on new coal plants at a rate of 1 every 10 days or one a month depending on the reports you read. Transportation is the next major source The most carbon intensive activity however is jet travel. One gallon of gasoline adds 20 pounds of C02 to atmosphere US consumes 20 million barrels of oil /day European union burns 14 million /day China unknown.
Greenhouse gases cause warming Four climate modeling centers undertook the task of identifying if C02 is the cause of the .5 degree warming that occurred in the 90’s ( a known value). Each center collected their own data and designed their computer programs. Blue Line: Tests without CO2 Red Line: Tests with CO2 Average surface temperature change (°C)
Ice core Data C02 and temp 400 392 350 280 400,000 years ago 200.000 years ago present day Current- 391 ppm, currently there has been a warming cycle every 100,000 years. The next ice age is ,at the earliest, 35,000 years
Melankovitch Cycle 100,000 year cycle The earth travels around the sun in a circular, then a oval pattern. The change happens about every 100 thousand years. Oval pattern = warm periods.(interglacial periods) Circular pattern puts the earth further away and brings on the ice ages (glacial periods). The next ice age is approximately due in about 35,000 years at the very earliest. Oval = warm interglacial periods Circular= cold glacial periods Source Rahmstorf and Schelinhuber 2006
2010,temperatures worldwide have increased by an average of a little over 1ºF (.8º C. ) What has that 1 degree brought?.
Polar Ice Arctic The melt is occurring form the bottom up as warming ocean waters bathe the ice cap. Only .8 degrees warming that has occurred is believed not to be enough to cause this dramatic loss of ice. Scientists think that Black soot, released from burning oil and coal, spreads throughout the atmosphere and settled on the snow and ice and traps heat, speeding the rate of melt. Dark orange=thick ice Source: NASA . Ice loss = area twice the size of France
Ice reflects light and heat A “Positive feed back” that Speeds warming. Bare surface absorbs heat
Scientists at the University of Miami say Greenland's ice is melting so quickly that the land underneath is rising at an accelerated pace and is going up by nearly one inch per year and if current trends continue, that number will accelerate with loss of more ice mass. Speculation that the shift of weight form ice on land to the oceans will increase plate tectonic movements. (more earthquakes)
Greenland Ice Loss • Since 2006, that has increased to 0.75mm per year. Ice melt 3-6 feet sea level rise by end of this century.
Oops! Melt of the Greenland ice was miscalculated. Scientists thought the water would sheet off the ice rather it collects in to huge lakes. The water melts a tunnel through the ice pack and carries the water to the rocky surface below. The water makes the surface slick and the ice cap begins to fracture and slide off the land forming icebergs. Many glaciers are sliding into the sea at an accelerating rate because of this and increases the rate of melt.
Greenland Ice Loss picture: global warming.com Melt water Lake tunnel Source gshox.blogspot.com
The Arctic, predicted early on to be the first and most affected by global warming has warmed 3-4 degrees whereas the rest of the planet is less than one degree of warming. Bubbling out of these bodies of water is Methane. This is another positive feed back to warming as Methane is 20 times more efficient at trapping heat than C02.
Map source chris.thejordansusa.com Tundra Tundra Tundra shrubs and grasses replaced By lakes, ponds, & puddles Methane release Photo source getenergysmartnow.com/
Warming and ice loss in Antarctica Discovery of melt around all of Antarctica, 2009. Temp 2-3around fringes colder in interior (NASA) Like the Arctic the melt of the ice shelves if coming form the warming waters that bathe the Antarctic shores. Loss of Wilkins ice shelf 2008 (Natl Snow & Ice data center)
This map shows the ocean circulation around Antarctic and shows how warmed waters can make it into the Antarctic region.
Sea Level Rise: Using a global mean, sea level back to 1870 found a sea-level rise from January 1870- December 2004 of 1.7 mm per year
Sea level rise drowning low elevation islands Tuvalu- Pacific islands only A few feet above sea level High tide in Tuvalu Maldives airport only 10’’ above high tide
Melting Glaciers Argentina - Patagonia The glacier in the subtropics are the ones of greatest loss. Many in Peru's and Bolivia are melting and scientist suggest some will be lost in the next decade. Some of these are critical fresh water supplies for farmers and others are major water supplies for large cities. 1928 2004 PERU Photo: Lonnie Thompson Ohio State U Photo ig Texas Uppsala Glacier
La Paz, Bolivia Photo source http://www.wallpaperstravel.com/ La Paz Bolivia, population of 1 million, depends on the Glacier melt in summer for their fresh water supplies. The glaciers are Expected to be lost during this decade.
Himalayan mountains are the highest in the world and provide snow melt and glacier melt that feeds the great rivers of Asia. The China’s yellow Yangtze, India’s Ganges, Pakistan's Indus rivers as well as the Mekong rivers are glacier fed. Speculation that the Gangotri, the glacier that feeds the Ganges river, might be gone as early as 2035, this mistake was repeated in the IPCC report and caused quite an uproar. But the Glacier retreat is speeding up and there is warming predicted of at 2 - 3 degrees more before C02 emissions are controlled. These rivers supply the most densely populated areas on the planet.
This shows the retreat of the glacier that feeds the Ganges river. Its retreat is increasing and the planet continues to warm. The water is used for farming and is the water supply for some of India’s largest cities. The glaciers of the Himalayas provide water for millions in China and India are under close scrutiny. Many are retreating, others are remaining stable but the ones that are stable are covered with debris. and some have increased in size. Gangotri Glacier that supplies Ganges River.
Carbon cycle • Forests act as carbon sinks • Forests absorb and store millions of tons of C02 annually • Many recommend protecting our forests and planting trees to help absorb the excess C02 we are releasing into the air. • Auto’s industry and coal fired plants add C02
The Boreal forests biome - Forest fires larger and hotter Canada- insect damaged trees Canadian and Alaskan forests are being badly damaged by bark and mountain beetles. Warming of only a few degrees shortens the life span of the beetle from 2 years to 1 yr. creating a population explosion, The beetles attack the forests killing the trees. The brown trees in this photo are dead trees, Photo source Bloomberg.com
Forests - The Boreal forests biome Map- Trevor Day, Biomes of the earth Photo: Uni. Alaska Fairbanks This aerial photo of the Kenai peninsula shows part of the dead forests also caused by beetle damage. Half of the forests of the Kenai have been lost according to the Alaskan Forest Service. .
Beetle damage- millions of acres of trees killed in western US Black Hills S. Dakota photo: Goddard center NASA Jen Chase / Colorado State Forest Service- photo Photo – Reuters. Colorado Aspens- dying in Col, Nevada, and Utah, cause of sudden aspen death unknown.
Dead Trees = Forest Fires . PHOTO- library.thinkquest.org/
Severe drought, heat waves, and bush fires since 1997- 2010 heavy rains flooded Queensland an area the size of France Murray/Darling River basin (dark green) irrigated farm lands made Australia one of the major breadbaskets of the world.
Hundreds of forest fires in Russia 2010 Summer 2010 map source.thinktosustain.com/ source /minnesota.publicradio.org 2010-2011- Extreme weather events world wide caused Billions In damage. From tornados in the US to heat wave/drought -forest fires in Russia
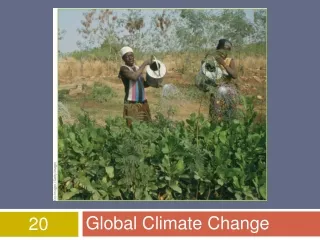
All people use energy and contribute CO2 • Everyone has a carbon footprint, (2009) 81 million per year is added to the planet. India, China, Pakistan, Nigeria, Ethiopia, Indonesia, US, Bangladesh, Zaire, and Iran - in that order! 10 calories of fossil fuels are required to produce every 1 calorie of food eaten US Population growth 500 million 308 million Average US family size 3 kids
Irrigated farmland in Oregon, California and other states provide up to 40% of food produced in America. From the Columbia river to the Colorado River our rivers also depend on snow and glacier melt for late summer water supplies which directly will affect our agricultural industry.
Glaciers world-wide are melting. Mt Hood’s glaciers Is just one example. Mt Hood 1985 and 2002 Photos Gary Braasch
Ocean Acidity Acidity of ocean waters has increased by 30% a .1 drop on the pH scale which is logarithmic. The acidity affects the dissolved calcium compounds found near surface waters of the oceans. Corals with calcium Cups Coccolithophores Photo- PhD M. Dimiza Pteropod antarctica.gov.au
Upweling of water brings old water to the surface that is depleted in dissolved calcium. This adds to the problem of having enough dissolved calcium for shelled animals. Especially a problem in the Pacific and along the West coasts of continents where upwelling areas are common.
Coral reefs under stress: Great barrier reef badly damaged by 2050 Map http://www.solcomhouse.com/ Photo (GBRMPA) Researcher early on predicted that the sub tropics would be hard hit by climate change. Corals grow in the tropics and sub tropics where ever sea water of 70 degrees is found Hot water events are occurring in Coral areas causing coral bleaching Happens most often in an El Nino Year .
Coastal Dead Zones Dead zones are nothing new They are found in many oceans near shore. Dead zones are caused by fertilizer run off that stimulates plankton growth. The overproduction of plankton which dies sinks to the bottom and decay removes oxygen from bottom waters. The result is death or flsh fleeing the hypoxic waters. The Mississippi river that drains the heartland of America delivers fertilizers from corn and soybean fields into the Gulf of Mexico.
Source: PISCO, OSU Extent of Dead Zone off Oregon 2006 source OSU Pisco
US uses 21 million barrels /day Worldwide Oil(yr2008) 85 million barrels/day 31 billion barrels/year PEAK OIL Since about 1980, annual production exceeds annual new discoveries Source Energy Watch Group (Germany) For every four barrels burned today, for one new barrel that is discovered.
Principal sources of US oil imports are Canada, Saudi Arabia, and Mexico (photo source unknown) Oil shale mining Canada
Open pit Coal Mining in Appalachian Mts. Photo Applachian voices & Southwings
Wind turbines Solar thermal plant- Seville Spain - 200 megawatt plants-source -CNET