Changing Atmosphere: Confronting Global Climate Crisis
470 likes | 527 Vues
Learn about the alarming effects of climate change, from rising CO2 levels to Arctic ice loss and ocean acidification. Scientific research confirms the urgent need for action to mitigate these growing threats.

Changing Atmosphere: Confronting Global Climate Crisis
E N D
Presentation Transcript
Global Climate Change Image: dreamatico.com
The source of the information presented here is from peer reviewed scientific research
How scientific research is conducted • Research scientists identify the question to be answered, they conduct a literature search on similar research to establish what is already known. They collect data, design and conduct experiments depending on the type of research, gather data analyzes data using statistics, and draws conclusions. They will then prepare a paper and submits it to a scientific journal for publication. • The journal will send out the manuscript to 3 other scientists with similar research interests to review the work. They will look at the methods of collecting data, review of the statistical analysis of the data and conclusions. If the work is shoddy it is rejected.
Changing our atmosphere Source goodwp-com We became aware of climate change in late 19th century when the natural greenhouse effect was first identified. Scientists began to warn that adding human emissions of greenhouse gases to our atmosphere could change earth’s climates.
The Greenhouse Effect Image: www.realscience.org.uk
MICHAEL MANN- DIRECTOR the Earth System Science Center at Pennsylvania State University Dr. Mann analyzed C02 and temp data, was one of the first to call attention to warming..
In addition to Dr. Mann’s work, four climate centers, confirmed the warming. Average surface temperature change (°C) Meehl et al., Journal of Climate(2004)
Ice core Data C02 and temp over centuries . 403ppm MAY 2015 350ppm (graph NASA) 5/9/2015- 403ppmC02- Highest level in 15 million years Source James Hanson head of NASA”S Goddard Space Flight center and a major Climate Research Center. 350ppm was long warned as the tipping point of no return on climate change 400ppm was reached January 2014. We have reached a level of C02 in the atmosphere never before experienced by this planet. ( Ice core data is a store of C02 levels that go back millions of years )
CO2 release per personblack = largest release Map Wikipedia
Ocean acidification C02 +water = carbonic acid . Credit: Christopher Krembs, NOAA, US Department of Commerce) An estimated 30–40% of the carbon dioxide released by humans into the atmosphere dissolves into oceans, rivers and lakes. Once dissolved in seawater, CO2 reacts with water, H2O,to form carbonic acid, CO2 + H2O ↔ H2CO3.
Image pmel.noaa.gov Ph has dropped by 30% in the oceans. Acidic water will dissolve the shells of ocean creatures “This is scary what we are dealing with right now very scary“-NOAA Director of Fisheries, Seattle (seminar presented at Hatfield Marine Center 2009
Warming in the Arctic-Temp anomalies 10 year average 2000-2009The Arctic is the area with greatest temp increase
The Arctic ice loss. 2014 the warmest year on record. . Lonnie Thompson Director of Byrd Polar Research Center NASA “Virtually all of us are now convinced that global warming poses a clear and present danger to our well being and to our civilization. . The red line marks former Boundary of the Arctic ice cap Image National snow and ice Data center The warming we have experienced so far is already bringing huge losses of Arctic ice Map-Source: National Snow and Ice Data Center (NSIDC) Ice loss in Arctic = an area twice the size of France
Positive FeedbacksIce loss leaves dark surfaces to absorbs heat Image credit NASA Hanson - Once the ice cap melt begins it will be VERY difficult to stop. Hanson’s Book “Storms of my grandchildren” NASA: Earth Is Losing Half A Trillion Tons Of Ice A Year plus there has been few measures taken to even slow the warming
Greenland Ice Loss Image courtesy of Konrad Steffen and Russell Huff, CIRES. 2011 NASA- satellite data -2011 Ice loss tied with the greatest since measurement began “these ice sheets are overtaking ice loss from Earth’s mountain glaciers and ice caps to become the dominant contributor to global sea level rise, much sooner than model forecasts have predicted. Pink = area of ice melt in Greenland. Land based ice melt will raise sea level
NASA - Earth is loosing a half trillion tons of ice/yr Greenland ice melt photo: e-world.com Hanson - Once the ice cap melt begins it will be VERY difficult to stop. Hanson’s Book “Storms of my Grandchildren”i
The Methane Bomb Of most concern for climate change, is the release of methane. It has a shorter life span in the atmosphere but it is 25 times better at trapping heat than C02. Researchers warned that gigatons of methane are stored in the frozen soils of the Arctic and also as caltrates (icy crystals that trap Methane) on the ocean floors. If we allow warming to go too far it too will be released. Congress failed to act and currently methane release has been measured in many areas. molecules of C02 and Methane Methane CO4
Arctic Tundra fires Tundra fire Tundra fires now burn across Arctic region. Photo Research.gov Leading experts at NOAA, the National Snow and Ice Data (see “NSIDC/NOAA reports): Thawing permafrost feedback will turn The Arctic from a carbon sink to a source in the 2020s, There are huge amounts of carbon stored in tundra soils and fears that it will be released with warming is being confirmed. How much, how quickly is being researched. : ,
Tundra Tundra - orange Map:www.keywordpicture.com Biomes of the world Source photobucket . Tundra melt, creates lakes where once was land covered with low shrubs and bushes. Bubbling out of those lakes is methane.
Methane release from East Arctic Sea Floor Russian Researchers Natalia Shakhova and Igor Semilitov. The East Siberia Sea is melting and now venting 1 million tons of methane per year. Methane is 25-30X more efficient at trapping heat than C02
Melting Glaciers Switzerland Argentina - Patagonia 1911 1928 2005 2004 - Upsala Glacier Photo: Swiss info Morteratsch Glacier Upsala Glacier: Argentina Image: Greenpeace
La Paz, Bolivia- snow melt supplies their water supply Snow cap melt Photo source: thezookeepershome
Low elevation Pacific islands in danger from rising seas Ice melt raises sea levels
Sea level rise drowning low elevation islands Photo by: all-that-is-interesting.com Maldives – low pacific islands -- Male, (shown here) is the capitol These islands are threatened by rising seas.
El Nino/La Nina cycles usually occur on 6year cycles and affects weather patterns La Niña conditions: Warm water is farther west than normal. Image: Wikipedia Image source: NOAA Climate change is predicted to bring bring more frequent El Ninos
Figures courtesy of J. Wallace, University of Washington Arctic oscillation flips from + to – and drives major weather patterns.
Climate change will increase extreme weather events • “It has long been known that as average temperatures increase, extreme heat events would become much more common. Global warming is tilting the odds so far in favor of certain types of extreme weather events that the standard caveat that global warming cannot be blamed as the sole cause of individual extreme weather events is no longer accurate. James Hanson testimony before congress. 1988
Typhoon Haiyan strongest ever recorded Photo wikipedia Pacific –typhoons Atlantic- hurricanes. Same type of storm. Photo: ABC.net.au SE Asia region, hardest hit was the Phillipines. Category 5 Strongest rating for Hurricanes/typhoons
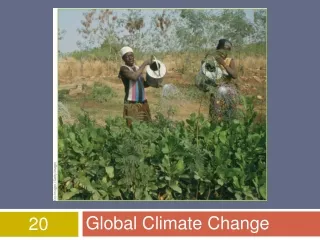
Climate change from a farmers perspective Image Peoriapublicradio.org Weather fluctuations such as floods, droughts, and heat-waves all have detrimental effects on crops and lower food production. This is also an era when more food is needed as population rises.
World population growth More people = more need for energy = More CO2 Another billion people will be added by 2050
PUBLIC ATTITUDESGallop poll 2010 Al Gore inconvenient truth . Changes in attitudes to climate change from 1989 - 2015 [ Gallup Polls ] found that 42 per cent of Americans think the media exaggerates the seriousness of climate change. 63% 2015
Ocean acidity The other C02 problem Ocean waters absorb C02 C02+H20= carbonic acid
Ocean Acidity from C02 harms shelled ocean organisms Coccolithophores photo source pin interest Pteropod Credit: Russ Hopcroft, UAF/NOAA copepods Photo Shannon Obrien
Public views on climate change • A common comment from the public is “The climate changes all the time”. • There are indeed many cyclic influences on weather patterns but none can permanently change the climate as the massive changes in the atmosphere that is now occurring from the addition of tons of C02 that traps and holds heat. • The next two slides looks at two common cyclic phenomena that bring temporary changes in weather patterns.
Little Ice Age: iStockphoto/Trevor Hunt) The last major climate change 1650 – 1850 • Temps dropped by 1°C • World population was 300 million, today 7 billion • The little ice age brought social disruption –crop failure, famine, riots, bark-bread, witch hunts, and immigration to US • Research has found the little ice age was caused by massive volcanic eruptions that blasted particles into the atmosphere and lingered in the air, reflecting heat, and lasted for 2 centuries
Rotation of earth around the sun, the cause of ice ages and warm eras. Source: Doug L. Hoffman’s blog
Ice ages/warm eras -these eras lasted for a hundred thousand years Graph:www.investigativemagazine.co.nz Earth currently is slowly emerging from the last glacial (ice) age. Ice covers the N and S poles, Snow covered mountains are also remnants of the last ice (glacial) age
Scientists statement on the status of climate change In 2014 enough C02 has been added to bring 2°C increase. Without serious effort to control C02, temps will exceed 2 degrees. That doesn’t sound like much but the massive amount of heat to raise temps WILL bring about changes that will be detrimental to our society. IPCC Durban S Africa 2011 International climate meeting:. Quote: “We will not see real progress on C02 reduction until we get the G20 nations (comprising ~80% of worldwide emissions) to seriously commit to emissions reductions. If G20 stalls until 2040 there will be 4 degrees of warming.”( quote from IPCC International panel on climate change) 4 degrees would bring many and mostly detrimental changes.