Download
1 / 68
680 likes | 718 Vues
Explore the effects of global warming on lake ecosystems, from changing precipitation patterns to declining productivity, with key insights on Lake Tanganyika. Investigate the biotic responses and implications for the environment.

E N D
Global Climate Change (Schneider, 1989) Global increase 0.6 +/- 0.2C
Causes • Infrared radiation trapped by greenhouse gases • CO2 levels has increased by more than 30% since 1850- Industrial Revolution • Due to fossil fuel combustion and land use • Other trace greenhouse gases have increased levels
Precipitation • Changes in precipitation and atmospheric moisture are expected due to global temperature increase • Cause changes in atmospheric circulation, increased water-holding capacity, and a more active hydrological cycle (Dore, M.H.I., 2005)
Precipitation • Global land precipitation has increased by about 2% since the beginning of the 20th century • Increased variance everywhere • Wet areas are becoming wetter, dry areas drier • Example: increased precipitation at high latitudes (Dore, M.H.I., 2005)
Precipitation in Africa (Hulme, M. et al, 2001) Large variability with recent drying Stable with some long term wetting Stable but with inter-decadal variability
Precipitation and Temperature in the Great Lakes (Mortsch and Quinn, 1996)
Direct Effects on Lakes (McDonald et al, 1994) Increase in lake temp caused by warmer air temperatures 3C increase
Direct Effects on Lakes (McDonald et al, 1994) • Looked at effects of global warming on lake trout in arctic lakes • Few species, simple food webs, lake trout act as keystone predators • Found trout must consume more food to reach the same size, and primary productivity has decreased • Young trout may not be able to survive winter if trend continues
Ice and Snow Covers on Lakes (Stefan and Fang, 1996) • Effects of projected climate change • Delay of ice formation by up to 20 days • Reduction of max ice and snow thickness by 50% • Ice cover period shortened by up to 50 days • Fish winter kills eliminated in shallow lakes
Climate change decreases aquatic ecosystem productivity of Lake Tanganyika, Africa Catherine M. O’Reilly, Simone R. Alin, Pierre-Denis Plisnier, Andrew S. Cohen & Brent A. McKee 2003
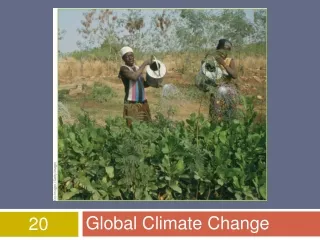
Economic uses • Provides income, food, drinking water, and transportation for an estimated 10 million inhabitants of its catchment area • Fishery provides 25-40% of animal protein supply for populations of surrounding countries- equivalent value of 10s of millions USD
Characteristics of the Lake Oligotrophic Permanently thermally stratified Anoxic hypolimnion
Cool Windy Season • May to September • Cool air and wind cause upwelling • Nutrient-rich waters of hypolimnion are an important source of some limiting nutrients for pelagic life
Fishery dominated by two clupeid speciesand a piscivore species Cool windy season important for mating due to nutrient availability from upwelling Limnothrissa miodon Stolothrissa tanganicae Lates stappersi
Recent Observations • Decline in pelagic fishery • Due to environmental factors, not overfishing • Decline in clupeid catch of 30-50% since 1970s • Contribution of piscivore species to catch has declined from 20-60% (1955) to 2% (1977)
Main Question The effects of climate change on the chemical and physical properties of lakes has been investigated, but what about biotic responses?
Methods Meteorological data from north from the Institut Géographique du Burundi Data from south from the Department of Meteorology, Zambia Water temperature was taken from pelagic zone in the middle of the basin All measurements taken during non-windy warm season except for wind speed
Rising Air Temperatures • Average rise of 0.5-0.7C per annum Annual Means: North- open circles South- filled circles Monthly averages in grey
Rising Water Temperatures a. Upper-water temperatures at 150m b. Deep-water temperatures at 600m • Upper water column temperatures have warmed about 0.1C per decade • Deep-water temperatures have increased 0.31C in the past 60 years
Decreasing Wind Velocity Windy Season Means: North- open circles South- filled circles Monthly averages in grey • Wind velocity has declined by 30% since the late 1970s • In the north, constant velocities until 1985 when there was a drop of about .6 ms-1 • In the south, after 1977 decrease of 1.8 ms-1 was recorded
Combined Effects • Increasing temperatures and decreasing wind speeds has caused an increase in stability and a reduced mixing depth • The stability of the water column during the non-windy season increased by 97% over 90 years
Combined Effects • Reduced mixing measured by the depth of the oxygenated zone • Showed shallowing trend of 1.6 myr-1 since 1939
Results Diminished deep-water nutrient inputs to shallow waters Decrease in primary productivity rates
Has Productivity Changed? Carbon isotopes in are used as an indicator of phytoplankton productivity A negative trend corresponds to a decrease in productivity Carbon isotope records measured in four sediment cores Beginning in mid-1900s, negative trend was observed
Carbon Isotope Records Filled symbols- undisturbed watersheds Open symbols- developed watersheds • From mid-1900s total average decline of a little more than 1‰ 13C which would indicate a decrease in primary productivity rates of about 20%
Effect on Fisheries? • A 20% drop in productivity could cause a 30% decrease in fishery yields • Explains the observed decline in catch
The Future? • Predicted increase in temperature of 1.3-1.7C over the next 80 years for this region • Further increase in thermal stability and decrease in productivity
Effects of Climatic Warming on Lakes of the Central Boreal Forest D.W. Schindler, K.G. Beaty, E.J. Fee, D.R. Cruikshank, E.R. DeBruyn, D.L. Findlay, G.A. Linsey, J.A. Shearer, M.P. Stainton, M.A. Turner 1990
Northwestern Ontario boreal ecosystems Warm and arid Thin, sandy soil w/ low capacity for water storage Forest fires frequent when precipitation low
Main Question The boreal ecosystems in northwestern Ontario are expected to see some of the effects of global climate change. How will the lakes in this area be effected?
Data Collection • Recorded at the Experimental Lakes Area in northwestern Ontario • Period of about 20 years, with almost continuous warming and increasing incidence of drought • Results presented for Lake 239
Greenhouse Effect Increase Air Temp Lower Precipitation Increase Water Temp Increase Duration Ice-Free and Snow Disappears Earlier Increase Evapotranspiration Decrease Soil Moisture Decrease Runoff Increase Forest Fires Decrease Rate Water Renewal Decrease Forest Cover Increase Ion Concentration Increase Wind Velocity Lakes Clearer Increase Solar Energy Deepening of Thermocline Increase Phytoplankton Biomass
Greenhouse Effect Increase Air Temp Lower Precipitation Increase Water Temp Increase Duration Ice-Free and Snow Disappears Earlier Increase Evapotranspiration Decrease Soil Moisture Decrease Runoff Increase Forest Fires Decrease Rate Water Renewal Decrease Forest Cover Increase Ion Concentration Increase Wind Velocity Lakes Clearer Increase Solar Energy Deepening of Thermocline Increase Phytoplankton Biomass
Recorded an increase in mean annual air temperature • Increase of about 2C
Greenhouse Effect Increase Air Temp Lower Precipitation Increase Water Temp Increase Duration Ice-Free and Snow Disappears Earlier Increase Evapotranspiration Decrease Soil Moisture Decrease Runoff Increase Forest Fires Decrease Rate Water Renewal Decrease Forest Cover Increase Ion Concentration Increase Wind Velocity Lakes Clearer Increase Solar Energy Deepening of Thermocline Increase Phytoplankton Biomass
Increase in lake temp caused by warmer air temperatures • Both mean and maximum temperatures have increased
Greenhouse Effect Increase Air Temp Lower Precipitation Increase Water Temp Increase Duration Ice-Free and Snow Disappears Earlier Increase Evapotranspiration Decrease Soil Moisture Decrease Runoff Increase Forest Fires Decrease Rate Water Renewal Decrease Forest Cover Increase Ion Concentration Increase Wind Velocity Lakes Clearer Increase Solar Energy Deepening of Thermocline Increase Phytoplankton Biomass
Evapotranspiration • This is the combined processes of evaporation and transpiration • The increase in air and water temperatures have corresponded to an increase in evapotranspiration
Greenhouse Effect Increase Air Temp Lower Precipitation Increase Water Temp Increase Duration Ice-Free and Snow Disappears Earlier Increase Evapotranspiration Decrease Soil Moisture Decrease Runoff Increase Forest Fires Decrease Rate Water Renewal Decrease Forest Cover Increase Ion Concentration Increase Wind Velocity Lakes Clearer Increase Solar Energy Deepening of Thermocline Increase Phytoplankton Biomass
Caused by increasing global temperatures • Years with lower than average precipitation has increased since the mid-1970s
Greenhouse Effect Increase Air Temp Lower Precipitation Increase Water Temp Increase Duration Ice-Free and Snow Disappears Earlier Increase Evapotranspiration Decrease Soil Moisture Decrease Runoff Increase Forest Fires Decrease Rate Water Renewal Decrease Forest Cover Increase Ion Concentration Increase Wind Velocity Lakes Clearer Increase Solar Energy Deepening of Thermocline Increase Phytoplankton Biomass
Combined effect of decreased precipitation and increased evapotranspiration has caused a decrease in volume of run-off from terrestrial basins and a decrease in the rate of water renewal
Greenhouse Effect Increase Air Temp Lower Precipitation Increase Water Temp Increase Duration Ice-Free and Snow Disappears Earlier Increase Evapotranspiration Decrease Soil Moisture Decrease Runoff Increase Forest Fires Decrease Rate Water Renewal Decrease Forest Cover Increase Ion Concentration Increase Wind Velocity Lakes Clearer Increase Solar Energy Deepening of Thermocline Increase Phytoplankton Biomass
Soil Moisture • The increase in evapotransipiration and the decrease in precipitation have also led to a decrease in soil moisture
Greenhouse Effect Increase Air Temp Lower Precipitation Increase Water Temp Increase Duration Ice-Free and Snow Disappears Earlier Increase Evapotranspiration Decrease Soil Moisture Decrease Runoff Increase Forest Fires Decrease Rate Water Renewal Decrease Forest Cover Increase Ion Concentration Increase Wind Velocity Lakes Clearer Increase Solar Energy Deepening of Thermocline Increase Phytoplankton Biomass
Forest Fires and Forest Cover • An increase in forest fires has been caused by the combined effects of a decrease in soil moisture, an increase in temperature, and the already arid environment • Intuitively, an increase in forest fires also corresponds to a decrease in forest cover