Download
1 / 30

E N D
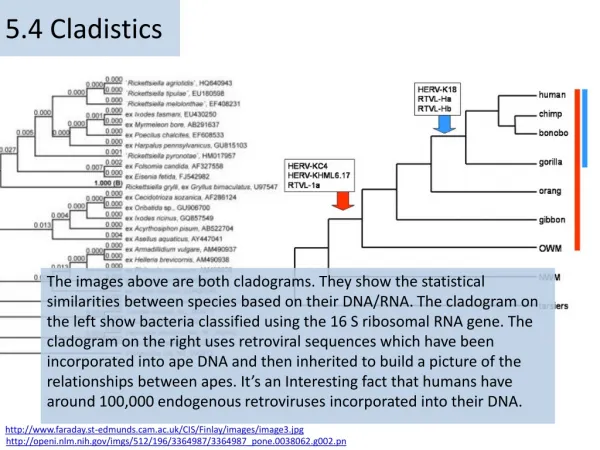
5.4 Cladistics The images above are both cladograms. They show the statistical similarities between species based on their DNA/RNA. The cladogram on the left show bacteria classified using the 16 S ribosomal RNA gene. The cladogram on the right uses retroviral sequences which have been incorporated into ape DNA and then inherited to build a picture of the relationships between apes. It’s an Interesting fact that humans have around 100,000 endogenous retroviruses incorporated into their DNA. http://www.faraday.st-edmunds.cam.ac.uk/CIS/Finlay/images/image3.jpg http://openi.nlm.nih.gov/imgs/512/196/3364987/3364987_pone.0038062.g002.png
5.4 • Essential idea: The ancestry of groups of species can be deduced by comparing their base or amino acid sequences.
5.4.U1 A clade is a group of organisms that have evolved from a common ancestor. Species may evolve over time to form a new species. Consequently there are . Such groups are called . Clades can be large (large clades can contain smaller clades) Clades can be small Not all members of a clade may exist today, e.g. dinosaurs • *Clades can be identified by snipping a branch under a node. Common ancestors often do not exist, as they have evolved into modern species or have become extinct. Common ancestor = an ancestor that 2 or more descendants have in common. http://evolution.berkeley.edu/evosite/evo101/images/reptileclade1.gif
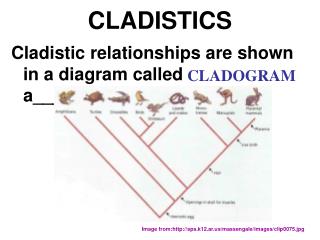
5.4.U5 Cladograms are tree diagrams that show the most probable sequence of divergence in clades. is a system of classification that groups taxa together according to the . A is a tree diagram showing the similarities and differences between different species The branching points on cladograms are called nodes. Nodes denote a speciation event when a common ancestor splits into two, or more, species.
are traits shared in different degrees by clade members. • more closely related species share more derived characters • represented on cladogram as hash marks
5.4.U5 Cladograms are tree diagrams that show the most probable sequence of divergence in clades. • These two cladograms are identical (although they don’t look it) • The shape and the order of the terminal nodes does not matter. • The only information to be gathered from the cladograms below is the order of nesting of sister clades and the relative relatedness of species http://commons.wikimedia.org/wiki/File:Identical_cladograms.svg
5.4.U5 Cladograms are tree diagrams that show the most probable sequence of divergence in clades. The are two descendants that split from the same node. The stems from the base of the tree and is outside the group of interest. http://evolution.berkeley.edu/evolibrary/article/phylogenetics_02
Out group: Defines the ancestral characters Sister clades: have a common ancestor Terminal nodes Human Chimp Human Chimp Gorilla Gorilla Nodes: Common ancestors Root
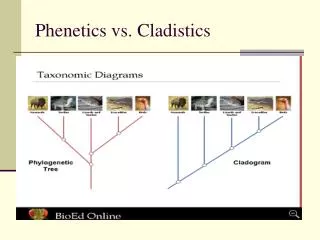
Morphology (study of the form and structure of plants and animals) is only part of the story in cladistics. are the primary basis for grouping organisms into clades and determining likely paths of evolutionary descent Ex: Crocodiles are more closely related to birds than lizards… Cladograms are mostly based on or the in a protein. Software applications combine multiplesequences* to find the most probable pattern of divergence. *Cladograms can show different relationships between species depending on the DNA/amino acid sequences used in the analysis. It is important therefore to use multiple sequences when trying to identify the true evolutionary relationships between species.
5.4.U2 Evidence for which species are part of a clade can be obtained from the base sequences of a gene or the corresponding amino acid sequence of a protein. • All known organisms use DNA as genetic material • The genetic code is universal. Gene sequences inserted in different organisms express the same proteins http://commons.wikimedia.org/wiki/File:Bdna.gif
The same 20 amino acids are used to make all proteins http://commons.wikimedia.org/wiki/File:Protein_primary_structure.svg
5.4.U3 Sequence differences accumulate gradually so there is a positive correlation between the number of differences between two species and the time since they diverged from a common ancestor. Mutations in DNA that persist and are inherited* occur at a predictable rate#. The at can be used as a molecular clock . * In species that reproduce sexually for mutations to be inherited they must occur during the creation of sex cells. #When considering multiple changes in the base sequence of DNA. The sample size is large enough to estimate a mean rate of mutation.
The assumption is that these changes occur at a regular rate. (which may not always be the case) Therefore if species A had 5 differences from species B and 10 differences from species C, then the lineages for A and C must have split twice as long ago as for A and B B C A The length of the lines separating species on cladograms is often used to represent the estimated time since they diverged. Time
5.4.A1 Cladograms including humans and other primates. has been completely sequenced and used to construct a cladogram between them. The DNA evidence used to build this cladogram of primates, including humans, can also be used to estimate when species diverged and hence when the common ancestor existed. https://sites.google.com/a/canacad.ac.jp/sl-hl-1-biology-4-ferguson/_/rsrc/1403598223535/unit-11-ecology/5-4-cladistics/primate%20cladogram.jpg
5.4.U2 Evidence for which species are part of a clade can be obtained from the base sequences of a gene or the corresponding amino acid sequence of a protein. 5.4.U3 Sequence differences accumulate gradually so there is a positive correlation between the number of differences between two species and the time since they diverged from a common ancestor. The protein that codes for it can lead to different amino acids making up the protein. Both cytochrome c molecules, while rhesus monkeys share all but one of the amino acids. This suggests that . I didn’t want to be closely related to stinking humans anyway! http://www.flickr.com/photos/stuffinhergoose/571672799/
5.4.S1 Analysis of cladograms to deduce evolutionary relationships. What animal is most closely related to a squirrel? What animals are more closely related to humans than old world monkeys? Tarsiers share a common ancestor with which animals? Elephant shrews, Elephants, Manatee and dugong all share a common ancestor. Which animal diverged from the ancestor first? http://commons.wikimedia.org/wiki/File:The_Ancestors_Tale_Mammals_cladogram.png
Sharks have a vertebrae, but none of the characteristics in the smaller circles. Frogs have vertebrae and two pairs of limbs, but not mammary glands or placenta. Kangaroo have vertebrae, two pairs of limbs, and mammary glands, but not mammary glands or placenta. Humans have all of the characteristics above and a placenta.
5.4.U6 Evidence from cladistics has shown that classification of some groups based on structure did not correspond with the evolutionary origins of a group or species. • Evolutionary Links • Classification allows us to see evolutionary relationships. Organisms that are grouped together share a lot of similar features (homologous structures). These shared characteristics help us see how organisms have evolved from a common ancestor. HOWEVER, morphology has its limitations in terms of evolutionary classification and DNA/ Amino Acid evidence is now far more accurate and trustworthy… e.g. Llamas were originally compared to sheep but a study of their genetics later placed them in the camel family http://www.flickr.com/photos/mrapplegate/2423991076/ http://www.flickr.com/photos/doug88888/3458057235/
5.4.A2 Reclassification of the figwort family using evidence from cladistics. • Until recently, Scrophyulariaceae(commonly known as ) were the 8th largest family of angiosperms (flowering plants). It grew from 16 genera in 1789 to 275 genera • Taxonomists recently examined
5.4.A2 Reclassification of the figwort family using evidence from cladistics. The similarities among the members of the old Scrophulariaceaefamily were superficial. The and evolved many times from different ancestors ( ). Different plant species adapted to and adopted . http://www.hopspress.com/Books/Images/Scrophulariaceae.jpg
5.4.A2 Reclassification of the figwort family using evidence from cladistics. • Less than half of the original species remain in the Figwort family; now only the 36th largest among angiosperms • Reclassification was helpful since the old Figwort family was too large and dissimilar to be a helpful grouping No longer a Figwort. Sad DNA evidence has cast doubt on some traditionally classified groups, but equally it has given support to others. Though DNA evidence is very important, it must be remembered that is not the only evidence used to decide evolutionary relationships.