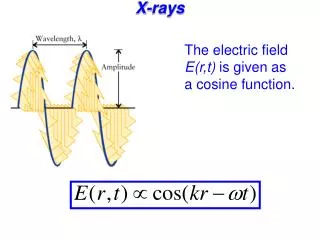
X-rays + Optical
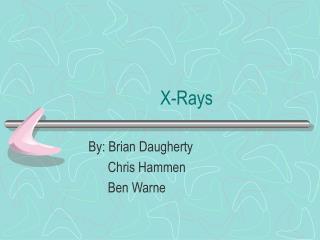
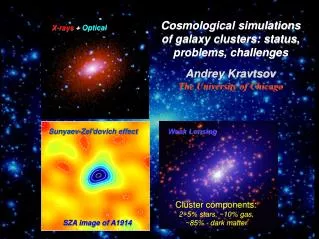
Cosmological simulations of galaxy clusters: status, problems, challenges. X-rays + Optical. Andrey Kravtsov The University of Chicago. Sunyaev-Zel'dovich effect. Weak Lensing. Cluster components: 2~5% stars, ~10% gas, ~85% - dark matter. SZA image of A1914.

X-rays + Optical
E N D
Presentation Transcript
Cosmological simulations of galaxy clusters: status, problems, challenges X-rays +Optical Andrey Kravtsov The University of Chicago Sunyaev-Zel'dovich effect Weak Lensing Cluster components: 2~5% stars, ~10% gas, ~85% - dark matter SZA image of A1914
Clusters form hierarchically z = 7 dark matter z = 5 z = 3 time z = 0.5 z = 0 z = 1 5 Mpc
gas density gas entropy Accretion, Mergers Shocks, Turbulence gas density gas entropy (slice) gas entropy Norman & Bryan 1998 Nagai, Kravtsov & Kosowsky 2003 Sunyaev, Norman & Bryan 2003 Dolag et al. 2005 10 Mpc
clusters are dynamically young nearby clusters distant clusters (z ~ 0.6) credit: A. Vikhlinin
nevertheless, we still believe that • clusters are regular (the simplest case is that of self-similar clusters – all poperties controlled by M) • exhibit tight relations between their total mass and observable properties such as temperature, gas mass, SZ flux • the scaling relations are simple – i.e., can be described by simple functions, such as power laws • the scatter of clusters around the mean relations is well-behaved distant clusters (z ~ 0.6) nearby clusters
we need realistic simulations of cluster formation to test how well the simple scaling models work and to evaluate effects of different physical processes, such as mergers, gas cooling, galaxy formation, etc… i.e., tostudy “known unknowns”, but simulations can also alert us about “unknown unknowns”, and even possibly teach us something new about things “we think we know we know” “As we know, there are known knowns. There are things we know we know. We also know there are known unknowns. That is to say, we know there are some things we do not know. But there are also unknown unknowns, the ones we don't know we don't know.” — Donald Rumsfeld. Feb. 12, 2002, Department of Defense news briefing
Collaborators Daisuke Nagai (University of Chicago -> Caltech) Alexey Vikhlinin (CfA, Harvard) + Oleg Gnedin (OSU), Andrew Zentner, Stelios Kazantzidis (U.Chicago), Anatoly Klypin (NMSU)
simulated cluster sample 16 individual galaxy clusters simulated with and without cooling virial masses from 8x10¹³ to 1015h-1 Msun Cosmological N-body+gasdynamics ART code (Kravtsov 1999, 2003; Kravtsov et al. 2002) mdm=3x10⁸h-1 Msun, m*~106h-1 Msun peak resolution ~ 2h-1 kpc 2-4 x 10⁷ mesh cells per cluster Gasdynamics: Eulerian AMR (2nd order Godunov) N-bodydynamics of DM and stellar particles Radiative cooling and heating of gas: metallicity dependent taking into account atomic and molecular processes Star formation using the Kennicutt (1998) recipe Thermal stellar feedback Metal enrichment by SNII/Ia + Advection of metals gas density dm density gas T stellar density gas entropy metallicity 10 Mpc
High resolution allows us to actually simulate clustersof galaxies • How galaxy formation affects the global cluster properties? • How well simulations reproduce observations of clusters? dark matter galaxies (stars) a Virgo-size cluster from our sample
Effect of dissipation on DM halo shape Kazantzidis, Kravtsov, Zentner, Allgood, Nagai, Moore, 2004ApJL 611, L73 also, Katz 1991; Evrard et al. 1993; Dubinski 1994; Tissera et al. 1998; Springel 2004 the same objects simulated with and without cooling Rvir
Effect of dissipation on the DM mass profile simulation of the same galaxy cluster with and without cooling and SF at r<0.1rvir – standard adiabatic contraction effect Eggen, Lynden-Bell & Sandage 1967; Zeldovich et al. 1980; Barnes & White 1984 fractional difference mass profile with cooling O. Gnedin, Kravtsov, Klypin, Nagai 2004, ApJ 616, 16 but the effect is actually non-zero all the way beyond rvir Kravtsov, Nagai Vikhlinin 2005, in prep. mass within r cluster mass profile without cooling cluster - centric radius in units of the virial radius
Effect of cooling on halo concentrations halo concentration Kravtsov, Nagai Vikhlinin 2006, in prep. c500 = r500/rs M500 - mass within radius enclosing overdensity of 500 x rcrit
Cluster concentrations: theory vs data halo concentration Chandra data: Vikhlinin et al. astro-ph/0507092 c500 = r500/rs M500 - mass within radius enclosing overdensity of 500 x rcrit
Effect of galaxy formation on the intracluster gas • a fraction of gas is converted into stars. Consequently: • Gas density is lowerat r > 0.05 R500 • Temperature is higher, except in the very center of the clusters • Entropy (~Tn-2/3) is higher, even at ~Rvir • Pressure (~nT) is lower • The effects only weakly depend on mass and approximate self-similarity of clusters (outside their cores, r > 0.1R500 ~ 0.05 Rvir) is preserved fractional difference between csf and adiabatic runs Nagai2005, ApJ in press (also, Bryan 2000; Kay et al. 2003; Borgani et al. 2004)
SZ flux – total mass relation • The relation is very tight • The scatter is <~10% in both adiabatic and CSF runs • The slope is consistent with the self-similar scaling law (slope5/3) • This is very good news for cosmology with SZ surveys! • Effects of galaxy formation: • The normalization is lower • by ~34% at R500c • by ~45% at R2500c (R500c/2) • Changes are in fgas, Tm and M • fgas-38% and Tm+9% at R500c z=0 and 1 Adiabatic Cooling+SF Y [Mpc2] Y/Y 1013 1014 1015 Total Mass [h-1M] Nagai2005, ApJ submitted also,da Silva et al. 2004 Motl et al. 2005
SZ flux - gas mass correlation: simulations vs observations galaxy formation moves the simulations closer to observed correlation SZ Flux [Jy Mpc2] corrected for evolution 1013 1014 Sample of 36 clusters (0.14 < z < 0.9) with BIMA/OVRO SZE + Chandra X-ray observations X-ray Gas Mass [h-1M] Data from John Carlstrom, Marshall Joy, Max Bonamente, Sam LaRoque Nagai2005, ApJ in press
Comparisons with observations: Chandra cluster sample • 13 relaxed clusters with deep Chandra exposures (Vikhlinin et al. astroph/0412306, 0507092) • Observations are optimized to trace gas density profile to ~r200 and gas temperature profiles to ~r500 => accurate measurements of gas and total masses, temperatures, gas fractions A1413
cluster cores are messy, but outer regions are self-similar total density profiles gas density profiles cluster-centric radius in units of r500 Vikhlinin, Kravtsov et al. 2006 ApJ 640, 691 (astro-ph/0507092)
Testing Chandra measurements with mock observations of simulated clusters • apply observational analyses to mock Chandra images, constructed taking into account instrumental response, background, etc. • compare measured quantities to the real values in simulations => gas mass accurate to ~3%, total mass biased by ~10%, temperatures are accurate to <~10% [Nagai, Vikhlinin, Kravtsov 2006] unrelaxed cluster relaxed cluster Mock Chandra photon maps of simulated clusters
mass – ICM temperature relation Tx is the X-ray spectral temperature of cluster gas measured excluding the cluster core r < 0.15 r500 Chandra clusters ~10% agreement in the amplitude between observed and model M-Tx relations! Total mass M500 scaled to z=0 Sim. clusters Scatter in sim. M-T is ~20% in mass at a given Tx – the scatter is primarily driven by unrelaxed systems X-ray spectral temperature (excluding core)
mass – ICM temperature relation Tx is the X-ray spectral temperature of cluster gas measured excluding the cluster core r < 0.15 r500 Chandra clusters Compared to old comparisons both simulations and observations moved towards each other… Total mass M500 scaled to z=0 Sim. clusters X-ray spectral temperature (excluding core)
mass – ICM gas mass relation M500-Mgas relation is tight (12-15% scatter) but the slope deviates from unity due to trend of gas fraction with mass Total mass M500 scaled to z=0 Sim. clusters Sim. clusters Kravtsov, Vikhlinin, Nagai astro-ph/0603205 Gas mass within r500
mass – Yx relation a new X-ray mass proxy Yx is an excellent mass proxy! scatter in Yx-M is ~5% for both relaxed and unrelaxed systems Total mass M500 scaled to z=0 Sim. clusters Kravtsov, Vikhlinin, Nagai astro-ph/0603205 X-ray “pressure” = Yx = gas mass x temperature
The product is better than its parts deviations of T and Mgas at fixed M500 anti-correlate and partially cancel in the product reducing the scatter
mass – Yx relation comparison with observations Normalizations of the model and observed Yx-M relations agree to ~10% Total mass M500 scaled to z=0 Sim. clusters Kravtsov, Vikhlinin, Nagai astro-ph/0603205 X-ray “pressure” = Yx = gas mass x temperature
gas density profiles yellow line: mean gas density profile for clusters in adiabatic simulations blue band: mean gas density profile for clusters in simulations with cooling and star formation width = rms scatter black line – profile for the coolest cluster (Tx~1 keV) gas density profile / rho_crit(z) cluster-centric radius in units of r500 (500 wrt rho_crit)
gas density profiles: simulations vs observations green lines: gas density profiles of relaxed Chandra clusters (Tx < 2 keV) yellow line: mean gas density profile for clusters in adiabatic simulations gas density profile / rhocrit(z) blue band: mean gas density profile for clusters in simulations with cooling and star formation width = rms scatter magenta lines: gas density profiles of relaxed clusters (Tx ~ 2-10 keV) from deep Chandra observations (Vikhlinin et al. 05) cluster-centric radius in units of r500 (500 wrt rho_crit)
gas temperature profiles yellow line: mean gas temperature profile for clusters in adiabatic simulations blue band: mean gas temperature profile for clusters in simulations with cooling and star formation width = rms scatter temperature in units of the mean gas mass-weighted temperature cluster-centric radius in units of r500
gas temperature profiles: simulations vs observations yellow line: mean gas temperature profile for clusters in adiabatic simulations magenta lines: gas T profiles of relaxed clusters (Tx ~ 2-10 keV) from deep Chandra observations blue band: mean gas temperature profile for clusters in simulations with cooling and star formation width = rms scatter temperature in units of the mean gas mass-weighted temperature both simulated and observed clusters are not isothermal! green lines: gas T profiles of relaxed Chandra clusters (Tx < 2 keV) cluster-centric radius in units of r500
baryon content of clusters: adiabatic vs cooling simulations bar fraction (no cooling) bar fraction (runs with cooling) gas fraction (runs with cooling) baryon and gas fraction in units of the universal value gas fraction = gas mass / total mass baryon fraction = gas+stellar mass / total mass Kravtsov, Nagai & Vikhlinin 2005, ApJ, 625, 588 [astro-ph/0501227] virial mass
a baryon content puzzle bar fraction (no cooling) bar fraction (runs with cooling) gas fraction (runs with cooling) Chandra data (Vikhlinin et al. 05) baryon and gas fraction in units of the universal value gas fraction = gas mass / total mass baryon fraction = baryon mass / total mass Kravtsov, Nagai & Vikhlinin 2005, ApJ, 625, 588 [astro-ph/0501227] 2006, ApJ in preparation virial mass
(Near) future work • detailed comparisons of simulations with X-ray and SZ data at higher z • systematic comparison of cluster simulations performed with different cosmological codes • detailed comparisons of galaxies in simulated clusters with observed properties of cluster galaxies (luminosity function, colors, etc.) • studies of environmental effects on galaxy evolution in simulated clusters: starbursts, tidal effects, harassment • modeling AGN feedback in cosmological simulations • Applying improved mass proxies and measured baryon fractions to obtain cosmological constraints on Wm, s8, WL, …
Summary • Gas cooling and star formation affect the global distribution of dark matter within the clusters, as well as gas density and temperature profiles (and hence pressure and entropy). • However, outside their cores (r > 0.1R500~0.05Rvir) clusters remain approximately self-similar. This is consistent with Chandra observations. • Galaxy formation significantly affects normalization of the Y-Mtot and Tx-Mtot relations, but apparently not their slope and scatter. • The hot gas fractions in simulated clusters match the observed gas fractions very well, but stellar masses appear to be overestimated by a factor of ~2-3: • Are cluster baryon fractions significantly smaller than universal value? (If so, what process(es) suppress fbar?) • Or are we missing baryons in clusters? (if so, in what form?)
Simulated cluster galaxies: no significant spatial or velocity bias (bv=1.1) (if galaxies are selected using stellar mass) data: CNOC - circles (Carlberg ea 1997) + 2MASS - triangles (Lin & Mohr 2004) surface density profile Nagai & Kravtsov 2005 ApJ 618, 557 Faltenbacher, Kravtsov, Nagai & Gottloeber 2005 MNRAS 358, 139 astro-ph/0408488 projected cluster-centric radius in units of R200
Cumulative stellar mass function thick dashed lines: blue - composite stellar mass function of cluster galaxies [2MASS data; Lin et al 03]. black – mean of 4 cls. (SDSS; Mesheriakov & Vikhlinin 2005) normalized cumulative stellar mass function thincolorlines: stellar mass functions of galaxies in individual simulated clusters (Nagai & Kravtsov 2005, in preparation) stellar mass of galaxies
Galaxies in simulated clusters: the Mstar - Vmax relation red dashed line: best fit to simulated cluster galaxies M~Vmax3.4 galaxy stellar mass maximum of the circular velocity profile = (GM(<r)/r)1/2
Galaxies in simulated clusters: the Mr - Vmax ["Tully - Fisher"] relation magenta points: SDSS galaxies with MARKIII circular velocities (courtesy of Michael Blanton) galaxy r-band absolute magnitude blue points: galaxies in one of the cluster simulations Nagai & Kravtsov 2005 in preparation maximum of the circular velocity profile = (GM(<r)/r)1/2
Effect of dissipation on the DM density profile simulation of the same galaxy cluster with and without cooling and SF fractional difference density profile with cooling DM density profile times r2 clusterdensity profile without cooling Kravtsov, Nagai Vikhlinin 2005, in prep. cluster -centric radius
Effect of gas cooling on baryon and DM distribution O. Gnedin, Kravtsov, Klypin & Nagai 2004, ApJ 616, 16 one of the simulated galaxy cluster mass within r cluster -centric radius
Improved Adiabatic Contraction model Eggen, Lynden-Bell & Sandage 1967; Zeldovich et al. 1980; Barnes & White 1984 Standard Model homologous contraction, circular orbits Blumenthal et al. 1986 Ryden 1987 Improved Model [Gnedin et al. 2004]
Where are the extra (or missing) stars? • in the central galaxy and its envelope 3 clusters spanning an order of mag in total mass cluster galaxies stellar "envelope" normalized stellar mass profile central galaxy cluster-centric radius in units of r200
gas pressure profiles are remarkably self-similar even in the presence of galaxy formation Integrated pressure pressure red dashed line: mean gas pressure profile for clusters in adiabatic simulations blue band: mean gas pressure profile for clusters in simulations with cooling and star formation width = rms scatter This is very good news for the upcoming SZ surveys Nagai2005, ApJ in press cluster-centric radius in units of r500
gas entropy profiles entropy = T / n2/3 red line: mean gas entropy profile for clusters in adiabatic simulations blue band: mean gas temperature profile for clusters in simulations with cooling and star formation width = rms scatter solid black line – the coolest cluster (Tx~1 keV) Normalized gas entropy profile Borgani et al. 2004 cluster-centric radius in units of r500
gas entropy profiles: simulations vs observations red line: mean gas entropy profile for clusters in adiabatic simulations magenta lines: gas entropy profiles of relaxed clusters (Tx ~ 2-10 keV) from deep Chandra observations blue band: mean gas temperature profile for clusters in simulations with cooling and star formation width = rms scatter solid black line – the coolest cluster (Tx~1 keV) gas entropy profile / entropy at r500 green lines: gas entropy profiles of relaxed Chandra clusters (Tx < 2 keV) cluster-centric radius in units of r500