Download
1 / 5
50 likes | 159 Vues
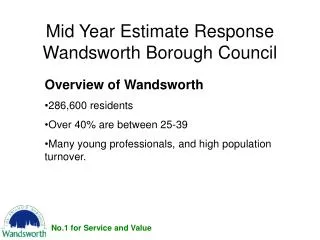
Mid Year Estimate Response Wandsworth Borough Council. Overview of Wandsworth 286,600 residents Over 40% are between 25-39 Many young professionals, and high population turnover. No.1 for Service and Value. HESA Data. Introduction of HESA data useful

E N D
Mid Year Estimate Response Wandsworth Borough Council • Overview of Wandsworth • 286,600 residents • Over 40% are between 25-39 • Many young professionals, and high population turnover. No.1 for Service and Value
HESA Data • Introduction of HESA data useful • Agree with student adjustments to Wandsworth’s total (gained 4,600 students) • Makes up for low GP registrations • Wandsworth’s 2007 New Housing Survey showed 32% of 20-29 year olds have no GP or registered at a previous address. No.1 for Service and Value
International Migration • Large change in cumulative results • November 2009 Consultation (minus 200 people) • May 2010 Revision (minus 4800 people) • Why is this? No.1 for Service and Value
International Migration - Inflows • Mid Year Estimates are below even the working international migrants inflows. No.1 for Service and Value
International Migration - Outflows • Large increase in International Migrant Outflow • Cumulatively 02-08, 4,292 extra out migrants • Most (4,228) of this occurs in 07 and 08, as seen in graph • What is the reason for this sudden change? - no local evidence • Lack of consultation of final results before they were released. No.1 for Service and Value