Box-and-Whisker Plots: Construct and Interpret | Educational Lesson
Learn how to construct and interpret box-and-whisker plots with examples on nutrition, attendance, and hockey data sets. Improve your data analysis skills!

Box-and-Whisker Plots: Construct and Interpret | Educational Lesson
E N D
Presentation Transcript
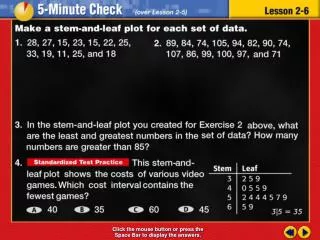
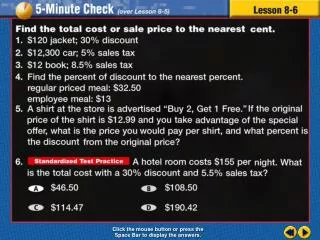
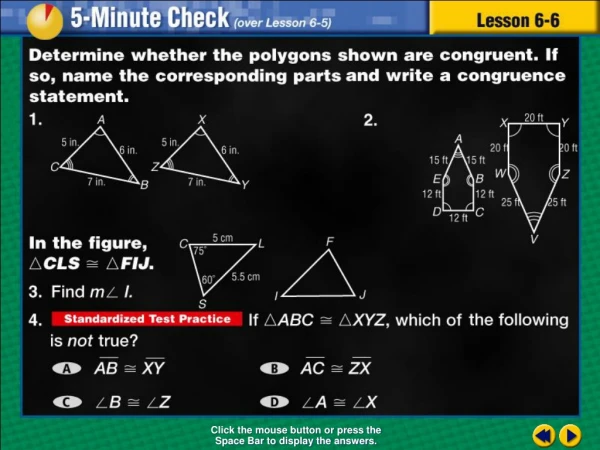
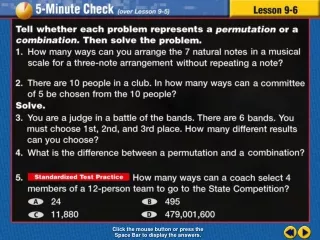
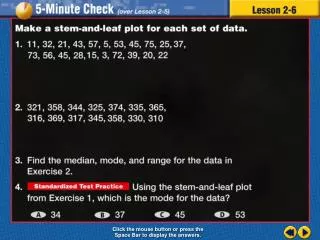
Transparency 6 Click the mouse button or press the Space Bar to display the answers.
Example 6-3b Objective Construct and interpret box-and-whisker plots
Example 6-3b Vocabulary Lower quartile The median of the lower half of the data set
Example 6-3b Vocabulary Upper quartile The median of the upper half of the data set
Example 6-3b Vocabulary Box-and-whisker plot A diagram that summarizes data by dividing it into 4 parts
Example 6-3b Vocabulary Lower extreme The least value of the data set
Example 6-3b Vocabulary Upper extreme The greatest value of the data set
Example 6-3b Vocabulary Interquartile range The difference between the upper quartile and the lower quartile
Lesson 6 Contents Example 1Construct a Box-and-Whisker Plot Example 2Analyze Data Example 3Identify and Plot Outliers
Nutrition Facts Item Fat (gm) Item Fat (gm) Bacon 9 Ham 14 Beefsteak 15 Pork chop 19 Bologna 16 Roast beef 5 Crabmeat 3 Salmon 5 Fish sticks 3 Sardines 9 Fried shrimp 10 Trout 9 Ground beef 18 Tuna 7 Example 6-1a NUTRITIONThe grams of fat per serving of items from the meat, poultry, and fish food group are shown in the table. Make a box-and-whisker plot of the data. Order data from least to greatest 3, 3, 5, 5, 7, 9, 9, 9, 10, 14, 15, 16, 18, 19 1/3
median: 9 Example 6-1a Find median Count the pieces of data and divide by 2 14 divided by 2 = 7 Beginning at smallest number, underline 7 pieces of data Beginning at largest number, underline 7 pieces of data 3, 3, 5, 5, 7, 9, 9, 9, 10, 14, 15, 16, 18, 19 Circle the 2 middle numbers Find the mean of the numbers 1/3
lower quartile: median of lower half = 5 Example 6-1a Find median of the first half of the data Count the pieces of data and divide by 2 7 divided by 2 = 3.5 Beginning at smallest number, underline 3 pieces of data Beginning at largest number, underline 3 pieces of data Circle the middle number that was not underlined 3, 3, 5, 5, 7, 9, 9, 9, 10, 14, 15, 16, 18, 19 1/3
lower quartile: median of lower half = 5 upper quartile:median of upper half = 15 Example 6-1a Find median of the second half of the data Count the pieces of data and divide by 2 7 divided by 2 = 3.5 Beginning at smallest number, underline 3 pieces of data Beginning at largest number, underline 3 pieces of data Circle the middle number that was not underlined 3, 3, 5, 5, 7, 9, 9, 9, 10, 14, 15, 16, 18, 19 1/3
lower quartile: median of lower half = 5 upper quartile:median of upper half = 15 Example 6-1a Identify the following 15 3 Upper Quartile = Largest Number = Smallest Number = Lower Quartile = Median = 19 5 9 3, 3, 5, 5, 7, 9, 9, 9, 10, 14, 15, 16, 18, 19 1/3
Example 6-1a Identify the following 15 3 Upper Quartile = Largest Number = Smallest Number = Lower Quartile = Median = 19 5 9 Draw a number line and plot the data above the number line 1/3
Example 6-1a Draw a rectangle using the LQ and UQ for the ends Draw a vertical line through the median Draw a horizontal line from the lowest number to the LQ Draw a horizontal line from the highest number to the UQ Answer: 1/3
Example 6-1b ATTENDANCEThe number of students attending class each day are shown in the table. Make a box-and-whisker plot of the data. Answer: 1/3
Example 6-2a HOCKEYThe table shows the ten all-time leading scorers in the National Hockey League through a recent season. Make a box-and-whisker plot of the data. Then use it to describe how the data are spread. Order data from least to greatest 396, 410, 487, 627, 645, 648, 717, 731, 801, 894 2/3
median: 646.5 Example 6-2a 396, 410, 487, 627, 645, 648, 717, 731, 801, 894 Find median Count the pieces of data and divide by 2 10 divided by 2 = 5 Beginning at smallest number, underline 5 pieces of data Beginning at largest number, underline 5 pieces of data Circle the 2 middle numbers Find the mean of the numbers 2/3
lower quartile: median of lower half = 487 median: 646.5 Example 6-2a 396, 410, 487, 627, 645, 648, 717, 731, 801, 894 Find median of the first half of the data Count the pieces of data and divide by 2 5 divided by 2 = 2.5 Beginning at smallest number, underline 2 pieces of data Beginning at largest number, underline 2 pieces of data Circle the middle number 2/3
lower quartile: median of lower half = 487 Upper quartile: median of upper half = 731 median: 646.5 Example 6-2a 396, 410, 487, 627, 645, 648, 717, 731, 801, 894 Find median of the second half of the data Count the pieces of data and divide by 2 5 divided by 2 = 2.5 Beginning at smallest number, underline 2 pieces of data Beginning at largest number, underline 2 pieces of data Circle the middle number 2/3
lower quartile: median of lower half = 487 Upper quartile: median of upper half = 731 median: 646.5 Example 6-1a Identify the following 731 396 Upper Quartile = Largest Number = Smallest Number = Lower Quartile = Median = 894 487 646.5 396, 410, 487, 627, 645, 648, 717, 731, 801, 894 1/3
Example 6-1a Identify the following 731 396 Upper Quartile = Largest Number = Smallest Number = Lower Quartile = Median = 894 487 646.5 Draw a number line and plot the data above the number line 1/3
Example 6-1a Draw a rectangle using the LQ and UQ for the ends Draw a vertical line through the median Draw a horizontal line from the lowest number to the LQ Draw a horizontal line from the highest number to the UQ 1/3
Example 6-1a Describe how the data are spread. Answer: The graph shows that ½ the players scored between 487 and 731 1/3
Example 6-2b COMMUTEThe table below shows the commute time from home to school for fifteen middle school students. Make a box-and-whisker plot of the data. Then use it to describe how the data are spread. 2/3
Answer: The graph shows that half of the students travel between 10 and 21 minutes. The largest range of the four quartiles is from 21 to 46. Example 6-2b 2/3
Candy Sold per Student 23 69 27 60 51 46 81 53 46 54 39 55 Example 6-3a CANDY SALESTwelve members of the music club sold candy bars as a fund-raiser. The table shows the number of candy bars sold by each person. Make a box-and-whisker plot of the data. Order data from least to greatest 23, 27, 39, 46, 46, 51, 53, 54, 55, 60, 69, 81 3/3
median: 52 Example 6-3a 23, 27, 39, 46, 46, 51, 53, 54, 55, 60, 69, 81 Find median Count the pieces of data and divide by 2 12 divided by 2 = 6 Beginning at smallest number, underline 6 pieces of data Beginning at largest number, underline 6 pieces of data Circle the 2 middle numbers Find the mean of the numbers 3/3
lower quartile: median of lower half = 42.5 median: 52 Example 6-3a 23, 27, 39, 46, 46, 51, 53, 54, 55, 60, 69, 81 Find median of the first half of the data Count the pieces of data and divide by 2 6 divided by 2 = 3 Beginning at smallest number, underline 3 pieces of data Beginning at largest number, underline 3 pieces of data Circle the 2 middle numbers Find the mean of the numbers 3/3
lower quartile: median of lower half = 42.5 Upper quartile: median of upper half = 57.5 median: 52 Example 6-3a 23, 27, 39, 46, 46, 51, 53, 54, 55, 60, 69, 81 Find median of the second half of the data Count the pieces of data and divide by 2 6 divided by 2 = 3 Beginning at smallest number, underline 3 pieces of data Beginning at largest number, underline 3 pieces of data Circle the 2 middle numbers Find the mean of the numbers 3/3
Example 6-3a Identify the following 23 57.5 Upper Quartile = Largest Number = Outlier = Smallest Number = Lower Quartile = Median = 81 69 42.5 81 52 23, 27, 39, 46, 46, 51, 53, 54, 55, 60, 69, 81 Notice there is an outlier in this data set Plot the outlier but do not use it as the largest number in the box-and-whisker plot 3/3
Example 6-3a Identify the following 23 57.5 Upper Quartile = Largest Number = Outlier = Smallest Number = Lower Quartile = Median = 81 69 42.5 81 52 Draw a number line and plot the data above the number line 3/3
Example 6-3a Draw a rectangle using the LQ and UQ for the ends Draw a vertical line through the median Draw a horizontal line from the lowest number to the LQ Draw a horizontal line from the highest number to the UQ Answer: 3/3
Points Scored 12 14 16 14 10 12 12 4 12 14 16 14 Example 6-3b BASKETBALLThe table below shows the number of points scored by the leading scorer of a basketball team during the past twelve games. Make a box-and-whisker plot of the data. Answer: 3/3
End of Lesson 6 Assignment