Download
1 / 1
10 likes | 44 Vues
Axis Direct presents daily derivatives report presenting recommendations based on technical analysis. For trading in derivatives visit https://simplehai.axisdirect.in/offerings/products/derivatives<br>https://simplehai.axisdirect.in/share-stock-prices/nse/DLF-Ltd-6890

E N D
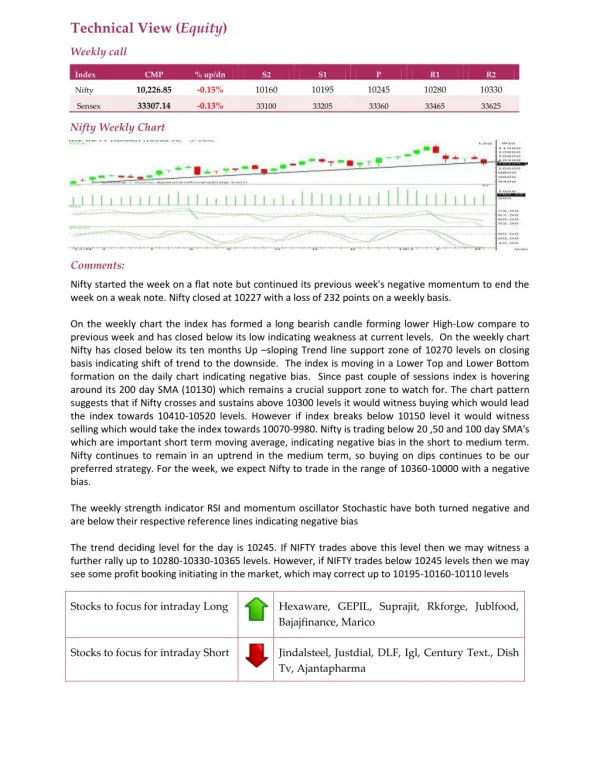
Technical View (Equity) Weekly call Index CMP % up/dn S2 S1 P R1 R2 10,226.85 -0.15% 10160 10195 10245 10280 10330 Nifty 33307.14 -0.13% Sensex 33100 33205 33360 33465 33625 Nifty Weekly Chart Comments: Nifty started the week on a flat note but continued its previous week's negative momentum to end the week on a weak note. Nifty closed at 10227 with a loss of 232 points on a weekly basis. On the weekly chart the index has formed a long bearish candle forming lower High-Low compare to previous week and has closed below its low indicating weakness at current levels. On the weekly chart Nifty has closed below its ten months Up –sloping Trend line support zone of 10270 levels on closing basis indicating shift of trend to the downside. The index is moving in a Lower Top and Lower Bottom formation on the daily chart indicating negative bias. Since past couple of sessions index is hovering around its 200 day SMA (10130) which remains a crucial support zone to watch for. The chart pattern suggests that if Nifty crosses and sustains above 10300 levels it would witness buying which would lead the index towards 10410-10520 levels. However if index breaks below 10150 level it would witness selling which would take the index towards 10070-9980. Nifty is trading below 20 ,50 and 100 day SMA's which are important short term moving average, indicating negative bias in the short to medium term. Nifty continues to remain in an uptrend in the medium term, so buying on dips continues to be our preferred strategy. For the week, we expect Nifty to trade in the range of 10360-10000 with a negative bias. The weekly strength indicator RSI and momentum oscillator Stochastic have both turned negative and are below their respective reference lines indicating negative bias The trend deciding level for the day is 10245. If NIFTY trades above this level then we may witness a further rally up to 10280-10330-10365 levels. However, if NIFTY trades below 10245 levels then we may see some profit booking initiating in the market, which may correct up to 10195-10160-10110 levels Stocks to focus for intraday Long Hexaware, GEPIL, Suprajit, Rkforge, Jublfood, Bajajfinance, Marico Stocks to focus for intraday Short Jindalsteel, Justdial, DLF, Igl, Century Text., Dish Tv, Ajantapharma