Digital Remote Sensing
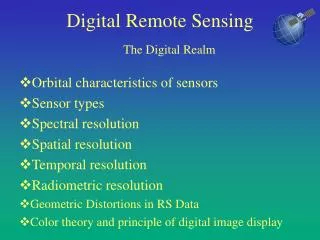
The Digital Realm. Orbital characteristics of sensors Sensor types Spectral resolution Spatial resolution Temporal resolution Radiometric resolution Geometric Distortions in RS Data Color theory and principle of digital image display. Digital Remote Sensing. The Remote Sensing Process.

Digital Remote Sensing
E N D
Presentation Transcript
The Digital Realm • Orbital characteristics of sensors • Sensor types • Spectral resolution • Spatial resolution • Temporal resolution • Radiometric resolution • Geometric Distortions in RS Data • Color theory and principle of digital image display Digital Remote Sensing
The Remote Sensing Process A. Radiation (Illumination) Source B. EMR Interaction with the Atmosphere C. Radiation Interaction with Target D.Recording Radiation with the Sensor E.Transmission, Reception, and Processing F. Interpretation and Analysis G. Application
Spectral Sensors • Instruments used to measure and record the strength of reflected or emitted EMR • The strength of the received signal is quantified (indexed) by the sensor using digital numbers (DNs). Digital Numbers (DNs)
Orbital Characteristics Geostationary • Satellites at very high altitudes (approximately 36,000 km) which view the same portion of the Earth's surface at all times. • Geostationary revolve at speeds which match the rotation of the Earth making them stationary, relative to the Earth's surface. This allows the satellites to observe and collect information continuously over specific areas. • Weather and communications satellites commonly have these types of orbits.
Orbital Characteristics Near-Polar (Sun Synchronous) • Remote sensing platforms designed to follow a north-to-south / south-to-north orbit which, in conjunction with the Earth's west-to-east rotation, allows the platform to cover the Earth's surface over a certain period of time. • Satellites in near-polar orbits are almost always sun-synchronous. This means that they cover each area of the world at a constant local time of day called local sun time. This makes it possible to study the same geographic location without having to compensate for illumination differences associated with time of day.
Near-Polar Sensor Characteristics • Altitude: The straight-line distance between the sensor and the Earth’s surface. Generally speaking, greater altitudes produce larger images with less detail. Conversely, platforms at lower altitudes produce smaller images with more detail. • Path: the route of the platform in its orbit around the Earth. • Swath: The width of the ground area recorded by a sensing system. • Scene: An image with an area defined by the swath width and a portion subsetted from the path to form a single image. (TM scenes defined by path/row).
Near-Polar Sensor Characteristics • Descending Pass: The north-to-south pass usually occurs on the shadowed side of the Earth. Sensors which measure reflected EMR are limited on the pass. Emitted energy can be recorded. Active remote sensors are not limited by lighting conditions (They supply their own illumination source). • Ascending Pass: the south-to-north pass usually occurs on the sunlit side of the earth. On this pass passive remote sensing systems use the sun as the illumination source to record reflected EMR. Emitted EMR can also be recorded on this pass.
Near-Polar Sensor Characteristics • On successive passes the sensor images a different swath of the Earth along its path. • Over time the entire surface of the earth is imaged. (16 days for Landsat TM). • Off-nadir viewing uses a tilt-able imaging device. This allows the sensor to view areas which are not directly under its path. This also allows the creation of images with significant side-to-side overlap for the production of stereo images.
Near-Polar Sensor Types: Across-Track “Whiskbroom” Example: Landsat Series • Scans the earth in a series of lines. The scan lines are oriented perpendicular to the direction of motion of the sensor platform (i.e. across the swath). • Each line is scanned from one side of the sensor to the other, using a rotating mirror. • The scan line is composed of individual recorded DNs. Each DN is a measurement of the reflected energy for a discrete square area unit of the Earth's surface (ground resolution cell) the size of which is determined by the spatial resolution of the sensor. • As the platform moves forward over the Earth, successive scans build up line after line of DNs to form a two-dimensional image of the Earth’s surface.
Near-Polar Sensor Types: Along-Track “Pushbroom” Example: SPOT Series • Instead of a scanning mirror, Along-track scanners use a linear array of detectors, called Charged Coupled Devices (CCDs), located at the focal plane of the image. Just Like A Digital Camera! • Each individual CCD measures the returned energy for a discrete square area unit of the Earth's surface (ground resolution cell) which correlates to 1 DN. If, for example, the sensor swath width is 100 meters and the ground resolution cell is 10 meters, 10 CCDs would be needed to scan the entire swath. For each CCD, the energy detected is sampled electronically and digitally recorded as a DN. • All the pixels in the linear array form a scan line.
Comparison: Across-Track/Along-Track • Field of View (FOV): The area that is visible to and recorded by the sensor during one scanning pass (scan line). • Instantaneous Field of View (IFOV): The area that is visible in the FOV and recorded by the sensor at a given moment in time. FOV=Swath IFOV= pixel FOV=Swath IFOV=Swath
Digital Image (Raster) Data An Array of Digital Numbers (DNs) can be displayed as picture elements (Pixels). Digital remote sensing systems convert Electromagnetic Energy (Color, Heat, etc.) to a Digital form so the data can be processed by Digital Computers, and Pixels allow us to “see” DNs as shades of gray or colors. Image Raster Array of Pixels Digital Numbers (DNs)
Origin (0,0) Pixel Rows Columns
Spectral: Relates to a range of EM Radiation. Spatial: Relates to size in 2 dimensional space. Temporal: Relates to frequency and time. Radiometric: Relates to electronic sensitivity and digital byte size. All About Resolution: 4 Types
Spectral Band • A image data set collected by a sensor with information from a discrete portion of the EM spectrum. TM Band 4 TM Band 2 TM Band 3 Green Red NIR
Multi-spectral Sensors • Sensors which acquire multiple images of the same target at different wavelengths (bands). Each spectral curve formed by multi-bands has unique characteristics about the target for each type of feature. Three bands can be displayed as a composite for visual interpretation.
Spectral Reflectance Curves • A Spectral reflectance curve for two classes of similar object: conifers and deciduous trees • Note how visible band is similar, but near IR band is very different • The shape of the curves will determine what bands we use to identify it
Differentiate deciduous and coniferous using spectral reflectance curves • Infrared B&W: can clearly see deciduous because of higher reflectance in those wavelengths • Panchromatic B&W: can’t tell deciduous from conifer
Spectral Resolution • The number and dimension of specific wavelength intervals of the electromagnetic spectrum to which a sensor is sensitive. • The finer the spectral resolution, the narrower the wavelength range for a particular band, and the greater the number of wavelengths intervals recorded.
Spectral Resolution High: Low: 1 Band Panchromatic: Composed of EMR from visible wavelengths only 3 Band Composite Multispectral: Composed of EMR from visible, Near-IR, and Mid-IR wavelengths
Hyper-spectral remote sensing Airborne Visible Infrared Imaging Spectrometer (AVIRIS) Datacube of Sullivan’s Island Obtained on October 26, 1998 224 bands
Spatial Resolution • The ability to distinguish between two closely spaced objects on an image. • The minimum distance between objects at which the images of the objects appear distinct and separate. • The 2-dimensional size (in ground units) represented by a pixel. • The finer the spatial resolution, the less the total ground area which can be seen, but at greater detail.
Spatial Resolution 10 Meter Resolution 30 Meter Resolution
Spatial Resolution Are You Ready for the Data? File Sizes for 3 Image Bands. Landsat TM (30 Meter Resolution) Ikonos Pan (1 Meter Resolution) Medium-Sized City 10 x 10 Miles 963,000 bytes (< 1 MEG) 1,734 MEG (1.7 GIG) An Average State 200 x 200 Miles 126 MEGABYTES 114 GIGABYTES Nation or Region 1000 x 1000 Miles 3 GIGABYTES 2.85 TERABYTES
Temporal resolution Radiometric resolution Geometric Distortions in RS Data Color theory and principle of digital image display Coming up next:
Temporal Resolution Frequency at which a sensor records imagery of a particular area (revisit capability). Useful for mapping land-cover changes and conducting time series studies. Date 1 Date 2 Date 3 Date 4
Landsat TemporalResolution Remote Sensor Data Acquisition June 1, 2001 June 17, 2001 July 3, 2001 16 days t
Radiometric Resolution • Defines the sensitivity of a sensor to differences in signal strength as it records electromagnetic radiation from the target. • The number of discernable signal levels which can be detected by a sensor. • The finer the radiometric resolution, the more sensitive it is to small differences in reflected or emitted energy.
Quantization The process by which analog scene brightness is converted into a digital number X Y 1 2 3 4 5 . . . 4.0 4.7 5.1 5.9 6.0 . . .
Quantization Levels Level of quantization is measured in bits, also called image depth The number of discernable signal levels is determined by the number of digital bit levels used to record the data. Bit levels act exponentially. 1 Bit = 2 possible signal levels (DNs) 3 Bit = 23 = 8 possible signal levels (DNs) 8 Bit = 28 = 256 possible signal levels (DNs) 24 Bit = 224 = 16,777,216 possible signal levels (DNs)
RadiometricResolution 8-bit (0 - 255) 0 9-bit (0 - 511) 0 10-bit (0 - 1023) 0
Radiometric Resolution 2-bit data (4 gray levels) 8-bit data (256 gray levels)
“Multi” Approach to Remote Sensing Made possible by the computing revolution. • Multispectral: using a variety of spectral bands. Hyperspectral: hundreds of discrete wavelengths. • Multi-temporal: Using data from many dates. • Multi-sensor: Data from an increasing number of sensors. • Successful Remote Sensing Scientists will devise new and innovative ways to create meaningful information from this data.
Transmission, Reception, and Processing After reflected or emitted energy is recorded by the sensor it must be transmitted, often in electronic form, to a receiving and processing station where the data are processed into an image.
The Remote Sensing Process A. Radiation (Illumination) Source B. EMR Interaction with the Atmosphere C. Radiation Interaction with Target D.Recording Radiation with the Sensor E.Transmission, Reception, and Processing F. Interpretation and Analysis G. Application
Geometric Distortions in RS Data • Pitch: Rotation of an aircraft about the horizontal axis normal to its longitudinal axis that causes a nose-up or nose-down attitude. • Roll: Rotation of an aircraft that causes a wing-up or wing-down attitude. • Yaw: Rotation of an aircraft about its vertical axis so that the longitudinal axis deviates left or right from the flight line. Effects of Pitch, Roll, and Yaw.
Systematic Distortions in RS Data • Scan Skew: Caused by the forward motion of the platform during the time required for each mirror sweep. The ground swath is not normal to the ground track but is slightly skewed, producing cross-scan geometric distortion. • Mirror-Scan Velocity Variance: The mirror scanning rate is usually not constant across a given scan, producing along-scan geometric distortion. • Platform Velocity: If the speed of the platform changes, the ground track covered by successive mirror scans changes, producing along-track scale distortion. • Earth Rotation: Earth rotates as the sensor scans the terrain. This results in a shift of the ground swath being scanned, causing along-scan distortion.
Non-Systematic Distortions in RS Data Altitude Variance: If the sensor platform departs from its normal altitude or the terrain increases in elevation, this produces changes in scale Platform Attitude: One sensor system axis is usually maintained normal to Earth's surface and the other parallel to the spacecraft's direction of travel. If the sensor departs form this attitude, geometric distortion results.
Geometric Correction for RS Data • Geometric correction: Image-processing procedures that correct systematic, non-systematic, and geometric spatial distortions in an image using ephemeris data. • Ephemeris: Any tabular statement of satellite parameters recorded at regular intervals. RS Satellites and ground stations record and maintain ephemeris data (velocity, pitch, radiometric calibration, solar elevation, etc.) along with image data so that the image data can be geometrically corrected at the ground receiving station. • Procedures for the correction of systematic errors are beyond the scope of this class, but geographic corrections (adjusting RS images to fit specific geographic projections, datums, etc.) will be covered in coming class sessions.
Maxwell’s Experiment Discrete portions of the EMS can be singled out and studied individually. Three black and white (monochrome) images can be used to create a color composite.
Color in the Computing Environment Computers use the additive system of color mixing which combines light to produce a range of colors. Red, green, and blue are the primary additive colors. Equal amounts of all three produce white light.
Mixing RGB for 8-bit Images Cathode Ray Tube (CRT) • What we call a computer monitor screen is actually a Cathode Ray Tube (CRT). When we are looking at a monitor screen we are looking at the rear exterior of the CRT. • The inside of the CRT is covered with hundreds of thousands of phosphor dots. Phosphor dots are designed to emit one of the three additive colors (RGB). These dots are arranged in groups of three (one each of RGB), called "triads.” Phosphor Dot Triad
Mixing RGB for 8-bit Images (continued) Color Guns (RGB) • Electron (color) guns fire a beam of electrons in varying proportions (depending on the DN values) at one of the corresponding phosphor dots in each triad. The glowing of the phosphor dots in the triad is controlled by the beam current: the greater the current the brighter the dot. • Because the three color phosphors are clustered very close together, they are viewed as one pixel. The color guns fire at the screen in a side to side, up to down sweeping pattern, redrawing the screen at an interval known as the refresh rate. Resulting Color Image (4-bit)
In color LCDs each individual pixel is divided into three cells, or subpixels, which are colored red, green, and blue, respectively, by additional filters (pigment filters, dye filters and metal oxide filters). Each subpixel can be controlled independently to yield thousands or millions of possible colors for each pixel. CRT monitors employ a similar 'subpixel' structures via phosphors, although the electron beam employed in CRTs do not hit exact 'subpixels'. Because they utilize red, green and blue elements, both LCD and CRT monitors are direct applications of the RGB color model and give the illusion of representing a continuous spectrum of hues as a result of the trichromatic nature of human vision.
3 Band Color Composites Grey Level Values or Digital Numbers (DN) Green Blue Composite Red