Download
1 / 16
160 likes | 338 Vues
Capacity Demand Curve in ISO-NE. Accounting for Uncertainty and Risk in Developing the Parameters to Support a Reliable System. Presentation to ISO-NE Stakeholders February 27, 2014. David Hunger Jeff Plewes Seabron Adamson.

E N D
Capacity Demand Curve in ISO-NE Accounting for Uncertainty and Risk in Developing the Parameters to Support a Reliable System Presentation to ISO-NE Stakeholders February 27, 2014 David Hunger Jeff Plewes Seabron Adamson
CRA evaluated the demand curve options for ISO-NE and has developed this set of comments to support stakeholder discussions • We would like to thank the Brattle Group for their time, both in discussing our considerations and in providing timely model results that helped inform our analysis
A capacity market should deliver an acceptable level of reliability, and that level should guide market design • On Jan 14, Brattle presented a set of demand curve objectives, with two pertaining to resource adequacy: • Maintain 1-in-10 LOLE target on a long-term average basis – note that this says nothing about how far and often the RM can land above and below a 1-in-10 based NICR • Rarely drop below a “minimum acceptable” reserve margin corresponding to a 1-in-5 LOLE level where ISO-NE might intervene in the market • Stakeholders have been comparing proposed demand curves based on frequencies below NICR (1-in-10) and “minimum acceptable” (1-in-5) without understanding the acceptable frequencies. • While the timeframe for this proceeding is too short for a comprehensive review of ISO-NE reliability standards, we offer the following to put the frequencies in perspective: • With an assumed Value of Lost Load (VOLL) of $10,000-20,000,1 an additional 2.4 hours of outage events per year (from 1-in-10 to 1-in-5) could cost residents and businesses in New England hundreds of millions of dollars, depending on the depth/duration of the outages • Additional capacity has energy market contributions not accounted for in this analysis • We suggest erring on the side of caution until there is reasoned consensus on changing the standard (How would NERC respond to a large event after New England accepts a demand curve with high frequencies of low reliability?) 1. Based on comments from the External Market Monitor filed in ER14-1050 on February 13. 2014 2
There is Missing Money because reliability standards reduce energy-market earnings. Energy Market Net Annual Revenues Required Reserve Margin Annual Cost of New Entry R* MissingMoney R^ “Economic Equilibrium” Reserve Margin Generation Reserve Margin
A reminder of the need to fill the “missing money” gap • The need for a capacity market arises from the “missing money” and hence is about economics, but also the ability to produce energy and ancillary services is essential to the system. • Missing money may have differing connotations depending on where you sit. • Given the characteristics of the supply curve, and the fact that the one-in-ten reliability standard requires a reserve margin of 10-15 percent, there is an insufficient revenue stream in the energy markets to build and maintain a sufficient level of resources to meet that need. • The demand curve needs to generate sufficient revenues (and expected revenues) to fill the gap and maintain resource adequacy.
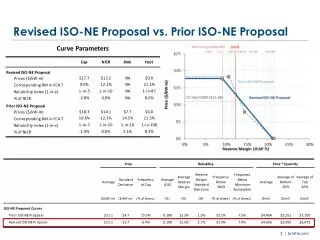
The range of results to date illustrate a wide range of expected reliability outcomes, with only modest cost differences Comparison of model results to-date – Cost vs. Reliability Frequency below NICR % below NICR - vertical % below min - vertical Frequency below minimum acceptable 3
The range of results to date illustrate a wide range of expected reliability outcomes, with only modest cost differences Comparison of model results to-date – Cost vs. RM Average reserve margin (+/- 3 std dev.) 2017/18 NICR 1-in-10 LOLE LOLE 3
The range of results to date illustrate a wide range of expected reliability outcomes, with only modest cost differences • The most interesting lessons learned from other stakeholders’ submissions: • Takeaway 1: These curves have not been thoroughly tested for how they perform if there is assumed error in Net CONE calculations, but they still provide insight. • Takeaway 2: Some curves lead to higher frequencies below NICR and minimum acceptable than the current vertical “curve” and to LOLEs well above 1-in-10. These should not be considered. • Takeaway 3: The increased cost of $100 million/year to move to very low frequencies below “minimum acceptable” is only 0.6% of total system costs. And this analysis does not consider the energy market savings of increased reserve margins.
The CRA requested model runs were designed to illustrate the sensitivity of several demand curves to discrepancies in administrative vs. “true” Net CONE values
The CRA requested model runs were designed to illustrate the sensitivity of several demand curves to discrepancies in administrative vs. “true” Net CONE values* • Key takeaways from the results of our requested simulations: • When E&AS offsets are high, there is little difference in system cost regardless of the cap level • Setting the price cap on Net CONE leads to a de-facto price cap of 1x Gross CONE when E&AS offsets are expected to be high (> 50% of Gross CONE). This price cap could actually be below true Net CONE if the reference technology is wrong. • Setting the price cap on a Gross CONE multiple allows the market to remain sustainable when E&AS offsets are highly uncertain, and even when the reference technology is off by a factor of 50% (more so when using 2x Gross CONE) * Our requests were originally designed to also highlight the issue of getting Gross CONE (mostly the reference technology) very wrong. The numbers we sent to Brattle for analysis were focused on the possibility of a Frame/CC blend based on a draft proposal. They are not based on using only a CC as the reference technology (as most recently proposed). The results are still informative.
There are many sources of uncertainty in Net CONE, especially in current market conditions in New England • Level of Gross CONE • Reference technology selection • We see valid arguments for both the CC and the LMS100/LM6000 (“aeroderivative”) CTs • We also see good reason to reject the Frame CT in New England, even if FERC has approved it for New York • If the CC is selected, the issues discussed on the previous slide become even more important than if the aeroderivative CTs are selected • Cost of capital
There are many sources of uncertainty in Net CONE, especially in current market conditions in New England • Energy & AS offsets • The main drivers of the E&AS offsets for the likely new forms of generation are electricity prices (highly correlated with gas prices) and, particularly for peakers, scarcity pricing frequency • Each of these decrease with a higher RM, but they are extremely uncertain, particular due to the uncertainty of gas pricing in New England going forward Recent Gas Prices (Algonquin Citygate), $/MMbtu
There are many sources of uncertainty in Net CONE, especially in current market conditions in New England • Supply shocks • Use of historical supply offers from FCA 1-7 may not be very strong predictors of future FCA offers due to elimination of the price floor; • Standard deviation of supply shocks may be understated; • Ideally the shocks could be adjusted for FCA 8 • Lack of persistence of supply shocks misses an important market dynamic (albeit a much more difficult modeling exercise).
Possible solutions to providing reliability in uncertain times • Using a multiple of Gross CONE for the price cap • Used by NYISO – not even a point of discussion during recent demand curve reset conversations • Price cap: “A horizontal line segment, consisting of all points for which the price of ICAP is equal to 1.5 times the estimated localized levelized cost per kW-month to develop a new peaking unit in each Locality or in the Rest-of-State region (for the NYCA ICAP Demand Curve),..” ICAP Manual, Section 5.5 • Clear advantage when Net CONE is highly uncertain • The concept of ex-post E&AS adjustments is not required simply for using Gross CONE in the price cap, but rather if the entire curve is based on Gross CONE – the market will equilibrate at Net CONE if it falls on the curve (hence we are not suggesting changing the kink being based on Net CONE) • Brattle estimates 2x Net CONE is currently very close to 1.5x Gross CONE • Adjusting Net CONE calculation for uncertainty • Each element of Net CONE should be subject to review and adjusted for uncertainty
Stakeholder submitted demand curves (from Brattle 2/21/14) – NextEra and Proposed Candidate Curve price caps would be similar based on reference technology
Conclusion: With so many uncertainties and a potentially high cost of getting the curve “wrong,” we suggest a curve resilient to administrative Net CONE error. The sloped curve will prevent any significant over-builds and the cost of additional reliability does not appear high within the realm of suggested curves, especially when considering the added value of new resources in the energy market. As New England progresses through other market changes and additional expansion (fuel availability, new builds, etc.), much will be learned to inform future curve adjustments.