BOILING POINT TRENDS ACROSS PERIOD 3
90 likes | 294 Vues
BOILING POINT TRENDS ACROSS PERIOD 3. BOILING.

BOILING POINT TRENDS ACROSS PERIOD 3
E N D
Presentation Transcript
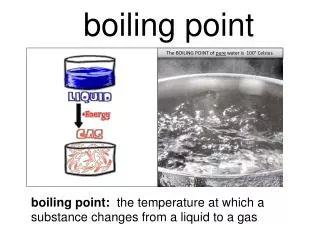
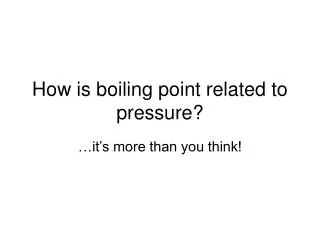
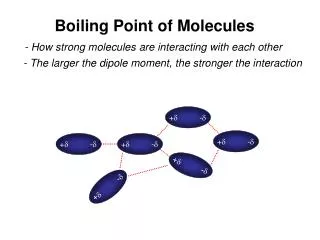
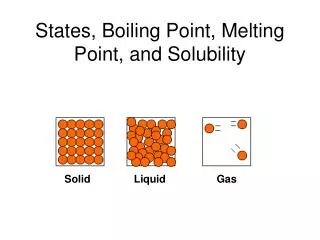
BOILING • When a substance boils, most of the remaining attractive forces are broken so the particles can move freely and far apart. The stronger the attractive forces are, the more energy is needed to overcome them and the higher the boiling temperature.
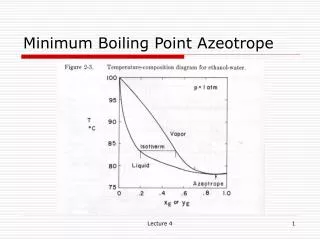
The trends in melting points and boiling points going across Period 3 are not straightforward, and need more detailed consideration than the trends in Group 2 • Boiling points generally increase going from sodium to aluminium, then decrease to argon
Sodium, magnesium and aluminium are all metals. They have metallic bonding, in which positive metal ions are attracted to delocalised electrons. Going from sodium to aluminium: • the charge on the metal ions increases from +1 to +3 (with magnesium at +2) ... • the number of delocalised electrons increases ... • so the strength of the metallic bonding increases and ... • the melting points and boiling points increase.
REFERENCES • http://www.creative-chemistry.org.uk/alevel/module1/documents/N-ch1-32.pdf