Boiling and Boiling Point
Boiling and Boiling Point. FIGURE 12-21. Boiling water in a paper cup. Liquid boils at low pressure. FIGURE12-21. Boiling water in a paper cup. Class Example – Clapeyron Equation:.


Boiling and Boiling Point
E N D
Presentation Transcript
Boiling and Boiling Point FIGURE 12-21 Boiling water in a paper cup Liquid boils at low pressure FIGURE12-21 Boiling water in a paper cup General Chemistry: Chapter 12
Class Example – Clapeyron Equation: • 1. The vapor pressure of acetone, (CH3)2C=O, is 10.0 mm Hg at -31.1 oC. What is the vapor pressure of acetone at 15.0 oC if the enthalpy of vaporization of acetone is 31.3 kJ mol-1? (Great care with significant figures is required!) Does the answer make sense in terms of the kinetic theory of matter? If so, why? Use the data given to estimate the normal boiling point of acetone.
Clapeyron Equation • 2. How could you employ the Clausius-Clapeyron equation to obtain thermodynamic data without using calorimetry? What types of thermodynamic data can be obtained? What experiments would you conduct to determine a ∆Hvaporizationvalue for liquid water using the Clapeyron equation?
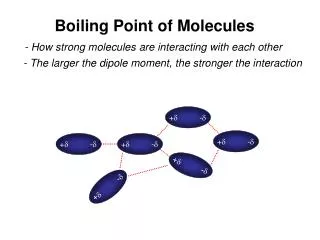
Coexistence Curves • Under a range of temperature and pressure conditions one can have liquid and vapor (gas) in dynamic equilibrium. Gas phase molecules are entering the liquid at the same rate as liquid phase molecules are evaporating. (No heat needs to be supplied for this process to occur. Why?) The simplest cases involve a pure liquid and a pure gas in equilibrium.
Vapor pressure curves of several liquids FIGURE 12-18 General Chemistry: Chapter 12
Coexistence Curve Calculations • 1.We used the Clausius-Clapeyron and a vapor pressure at one temperature to predict the vapor pressure at a second temperature (given ΔHVAP). 2.We also used a vapor pressure at one temperature (and ΔHVAP) to calculate the normal boiling point of a liquid (same as 1.?) 3. We can use the vapor pressure of a liquid at two temperatures to find ΔHVAP. Mention ΔHSUBLIMATION ?
Calculations Related to Coexistence Curves • One can imagine putting a volatile liquid in an empty container and seeing one of two results: • 1. All of the volatile liquid evaporates. In this case PGas will be less than the equilibrium vapor pressure of the substance/liquid. • 2. Only some of the liquid eventually evaporates. Here Pgasequals the equilibrium vapor pressure.
Class Example: • 1. A total of 3.00 g of liquid water was placed in an evacuated (initially) 12.0L container maintained at a temperature of 80.0 0C. Will a liquid/gas equilibrium be established? What piece of data is required to solve this problem? If no liquid/gas equilibrium is established, determine how much additional liquid water is required to have some liquid in equilibrium with H2O(g) in the container.
Critical Points • The normal boiling point of water is 100 oC. At this temperature the vapor pressure of water is exactly 760mm Hg (the normal average atmospheric pressure at sea level). If we heat water in a sealed container all of the steam that is formed is trapped above the liquid water. The additional steam formed increases the pressure of the gas above the liquid and “naturally” the boiling point rises.
Critical Points • There is a limit to how high we can raise the temperature of a liquid/gas mixture and still have a well-defined two phase equilibrium. One eventually reaches a temperature/pressure point beyond which there is only one fluid phase. The specific T and P where this occurs is referred to as the critical point of the substance.
The Critical Point FIGURE 12-22 Attainment of the critical point for benzene General Chemistry: Chapter 12
Critical Points • The next slide shows critical point data for a number of substances. Do the “permanent” and “non-permanent” gases differ appreciably if one considers intermolecular forces?
Other Coexistence Curves • For substances such as molecular iodine which sublimes readily at ambient temperatures we can have another type of equilibrium • I2(s) ↔ I2(g) • At a particular temperature and pressure the vapor pressure of solid iodine is well defined. We can construct a coexistence curve illustrating the T’s and P’s where the solid and gas are in equilibrium.
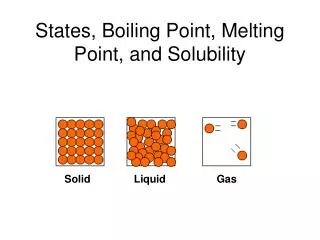
Some Properties of Solids Melting, Melting Point, and Heat of Fusion Figure 12-23 Figure 12-24 Heating curve for water Cooling curve for water H2O(s) H2O(l) ΔHfus(H2O) = +6.01 kJ/mol General Chemistry: Chapter 12
Sublimation FIGURE 12-25 Sublimation of iodine ΔHsub = ΔHfus+ ΔHvap = -ΔHdeposition General Chemistry: Chapter 12
Phases Changes – Signs of ΔH’s: • The left to right processes below are endothermic(remember intermolecular forces!). • C2H5OH(s) → C2H5OH(l) → C2H5OH(g) • The opposite processes are necessarily exothermic. We will soon see processes where ΔH for ionic deposition process is extremely exothermic (Eg. Na+(g) + Cl-(g) → NaCl(s)).
More Coexistence Curves: • We can usually represent (s) ↔(g) and , as well, (l) ↔ (g) coexistence curves on the same graph. We can also look at (s) ↔ (l) coexistence curves – in this case we see melting point values that change very slowly as the pressure changes. Plotting all three coexistence curves (and sometimes more!) on a single graph gives us a phase diagram.
Phase diagram for iodine Iodine General Chemistry: Chapter 12
Carbon Dioxide Phase diagram for carbon dioxide General Chemistry: Chapter 12
Critical Point and Triple Point • We’ve discussed the critical point. The previous two graphs show in each case three coexistence curves meeting at one (unique!) point. This so-called triple point is well defined for a pure substance. At the triple point we have solid, liquid and gas phases simultaneously in equilibrium. What triple point is central to life in St. John’s?