Understanding Melting and Freezing in Physics
431 likes | 1.27k Vues
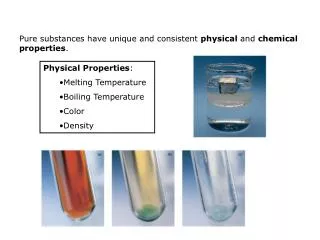
Learn about the process of melting and freezing, the concept of melting point, and how temperature affects the transformation of solids to liquids and vice versa. Explore the kinetic theory of matter to understand the science behind these phase changes.

Understanding Melting and Freezing in Physics
E N D
Presentation Transcript
MELTING AND BOILING SEC 3 PHYSICS
Melting • Let us recall; • Melting is a change of state from solid to liquid. • Melting occurs at a fixed temperature. • This temperature is known as the melting point of the substance. • Eg. Melting point of water is 0oC or 273 K
Melting • Let us remove an ice cube from the freezer and place it under the hot sun which is about 35oC. • Assuming that original temperature of ice cube is about -20oC. What will you observe after sometime? • It is obvious that after sometime, the ice cube will start to melt and eventually solid ice cube will turn into water totally.
Temperature Temperature 35oC 35oC S R 0oC 0oC Q Q R Time Time -20oC P P Graph B Graph A Melting • If you were to measure the temperature of the ice cube as it slowly turns from a solid state to a liquid state, which would be the situation that you would observe? Graph A or B? -20oC
Temperature 35oC S 0oC Q R Time -20oC P Graph B Melting • The result that one would observe is that of Graph B! • Interpreting the Graph: • P-Q: Temperature of ice cube increases from -20 0oC. Ice cube remains a solid. • Q-R: Ice cube starts to melt. Solid changing to liquid. During this stage, substance is both in solid-liquid state. No change in temperature. • R-S: Solid ice cube has changed totally to liquid water. Temperature of water increases from 0 35oC. Graph B is known as the Heating Curve
Temperature 35oC S 0oC Q R Time -20oC P Graph B Melting • This observation is TRUE for almost ALL pure solid substance during melting. • During melting, temperature of the substance remains constant (fixed) at the melting point for some time; until all solid has changed to liquid, before its temperature increases again. • WHY?
Temp S Q R Time P Melting • To explain this phenomena, we have to look at it from the kinetic theory of matter. • P-Q: • Ice is at a low temperature compared to hot air. So thermal energy from surrounding will move into ice. • This thermal energy absorbed by ice, is changed to KE. The result we see is particles of ice vibrating faster. • When particles vibrate faster, it results in a change (increase) in temperature. • Thermal energy will be continually absorbed as long as there is a temperature difference btw ice and surrounding.
Temp S Q R Time P Melting • Q-R: • The amount absorbed will reach a level such that the KE of particles are enough to break the particles from the inter-molecular forces of attraction holding them together. • During this stage, whatever thermal energy absorbed will not change into KE, but is used to break the forces of attraction. • This is why the temperature during melting is constant.
Temp S Q R Time P Melting • R-S: • Once all solid ice has turned into liquid state, energy is no longer needed to break the attractive forces. • Since liquid water is at a lower temperature compared to surrounding, it will still absorb thermal energy from hotter surrounding. • This thermal energy is changed into KE and as a result, particles move faster, causing an increase in temperature. • When the temperature of liquid water has reached that of the surrounding, no more thermal energy transfer will happen. Its temperature will be equal to the surrounding.
Temp Temp Temp S S S Q Q Q R R R Time Time Time P P P Melting – molecular level SOLID MELTING LIQUID • KE constant • Thermal energy used • to break attractive • forces btw particles • Temperature constant • KE increases • Particles vibrate faster • Temperature increases • KE increases • Particles vibrate faster • Temperature increases
Freezing • The reverse to melting is freezing or solidification • Freezing is the process of change from liquid to solid state. • Freezing occurs at a fixed temperature. • This temperature is known as the freezing point. • A pure substance freezes at a temperature equal to its melting point. • This means that for the same pure substance, its freezing point is the same as its melting point.
Temperature / oC J 90 K L 78 M 0 Time/min Freezing • A typical cooling curve of a substance can be represented by the freezing of napthalene (moth balls) • Again it can be observed that during the freezing stage, KL, temperature remains constant at 78oC. • This means that 78oC is the freezing point of napthalene.
Freezing • Again to understand this phenomena, we have to approach the problem from the kinetic theory of matter.
Temperature / oC J 90 K L 78 M 0 Time/min Freezing • JK: • Napthalene is at a higher temp. compared to surrounding • Thermal energy is being transferred out of napthalene • Losing thermal energy means that KE of particles drops • Particles are slowing down, resulting in temperature drop.
Temperature / oC J 90 K L 78 M 0 Time/min Freezing • KL: • KE of particles are at such a level that the particles are no longer able to ignore inter-molecular force of attraction • As particles are being drawn into a fixed structured pattern, the average KE of all particles will remain the same until ALL napthalene changes to solid state • Hence there is no change in temperature although thermal energy is still being released to the surroundings. This energy released comes from bond formation.
Temperature / oC J 90 K L 78 M 0 Time/min Freezing • LM: • Once all napthalene has changed into solid state, the continual release of thermal energy due to temperature difference btw napthalene and surrounding, causes KE of particles to drop further. • The result of KE drop is that temperature of napthalene will also drop. • Temperature will drop until temperature of both napthalene and surrounding are the same.
Effect of Impurities on Freezing Point • When impurities are added to a substance, it would lower its freezing point. • Impurities are other foreign substances. • Example: • I have 2 cups of water, A and B. • I add salt to B. When I try to freeze the water in both cups, A would freeze at 0oC but B would freeze maybe at –10oC. • This means B would stay as a liquid even at 0oC or -2oC or lower until the temperature reaches –10oC. • When A becomes solid ice at 0oC, B is still liquid.
Effect of Impurities on Freezing Point (*optional) • Reason for this is that presence of impurities causes disruption to the formation of inter-molecular forces of attraction. • The particles of original substance would need to be slower (this means the average KE has to be lower) before they can be drawn into a fixed structured pattern by the forces.
Effect of Impurities on Freezing Point • Applications: • In cold countries, impurities are added to water in radiators of vehicles to prevent water from freezing • Salt are spread on roads during winter, so that water from melted snow will not form into ice easily. Ice is very slippery and is dangerous to traffic.
Effect of Pressure on Melting Point • Melting point of ice is lowered by an increase in pressure and is increased by a drop in pressure. • At higher pressure, an ice cube would melt at temperatures lower than 0oC. • At lower pressure (on the mountain), ice would only melt at temperatures higher than 0oC. Which is why there can be snow on the mountain top even when surrounding temperatures are above 0oC.
Effect of Pressure on Melting Point • Try this at home. Press two ice cubes just newly removed from freezer together for sometime. • Release the ice-cubes. • Both ice-cubes are ‘stuck’ together. • WHY?
Effect of Pressure on Melting Point • (*optional) • When a solid substance is subjected to high pressure, this pressure helps particles to overcome the inter-molecular forces holding them together. • As a result, it is not necessary for KE of particles to reach a high level before they are able to break free. • When pressure is lower, substance is more stable. Hence these particles would need more KE before they can break free from the forces of attraction. Result is that its melting point would be higher.
Boiling • Boiling is a change of state from liquid to gas. • Boiling occurs at a fixed temperature. During boiling, temperature remains constant. • Heat is taken in / absorbed during this process. • This temperature is known as the boiling point of the substance. • Liquid will remain at boiling point until all the liquid has changed to gas. • (phenomena is pretty similar to melting)
Temperature/oC 120 S 100 Q R 30 P 0 Time/ min Boiling • A typical boiling curve; for this instance, for water. • QR; where the temperature remains constant is the boiling stage.
Temperature/oC 120 S 100 Q R 30 P 0 Time/ min Boiling • PQ: • Water absorbs thermal energy, causing its particles to increase in speed (KE increases) • The result of KE increase is the rise in temperature
Temperature/oC 120 S 100 Q R 30 P 0 Time/ min Boiling • QR: • When KE of particles reach a certain level, it is strong enough to overcome the inter-molecular forces holding them together • At this stage, all thermal energy absorbed goes towards breaking the attractive forces • Particles are all now free to move freely and randomly • Substance has changed from liquid to gas state completely
Temperature/oC 120 S 100 Q R 30 P 0 Time/ min Boiling • RS: • Once in gas state, particles will speed up as it absorbs more thermal energy (from heating) • This results in temperature increase of substance
Condensation • The reverse of boiling is condensation. • It is the process of change from gas to liquid. • It occurs at a fixed temperature which is the boiling point of the substance. • Heat is given off during this process.
Temperature/oC 120 A 100 C B 30 D 0 Time/ min Condensation • A typical cooling curve for condensation • AB: • Thermal energy is being transferred out of water • Losing thermal energy means that KE of particles drops • Particles are slowing down, resulting in temperature drop
Temperature/oC 120 A 100 C B 30 D 0 Time/ min Condensation • BC: • KE of particles are at such a level that the particles are no longer able to ignore inter-molecular force of attraction • As particles are being drawn into a structured pattern, the average KE of all particles will remain the same until ALL water vapour changes to liquid state • Hence there is no change in temperature although thermal energy is still being released to the surroundings. This energy released comes from bond formation.
Temperature/oC 120 A 100 C B 30 D 0 Time/ min Condensation • CD: • Once all water vapour has changed into liquid state, the continual release of thermal energy due to temperature difference, causes KE of particles to drop further. • The result of KE drop is that temperature of liquid water will also drop. • Temperature will drop until temperature of both liquid water and surrounding are the same.
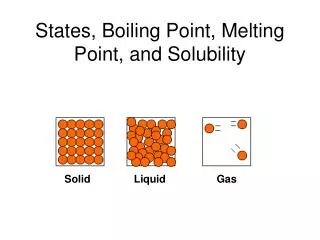
Temperature (oC) Mixture of liquid and gas state Gas state only Boiling point Mixture of solid and liquid state Substance in single state Melting point Substance in mixed state Liquid state only Time (min) Solid state only Melting and Boiling Curve of a Substance • A typical melting and boiling curve of a substance is as shown. Note the following:
Heating and Cooling Curve • From a heating or cooling curve, we can determine the melting (or freezing) and boiling (or condensation) points of a substance. • All we need to do is to look for horizontal straight line.
Effect of Impurities on Boiling Point • Adding impurities will raise the boiling point of an object. • That means to say the liquid will now boil at a higher temperature.
Effect of Pressure On Boiling Point • Lower pressure would lower the boiling point of water. • Water will boil very quickly on the mountain top but the temperature reached is lower than 100oC. • Increasing pressure would raise the boiling point of water. • Water will boil at a higher temperature above 100oC. Can we boil water at room temperature, 30oC?
Evaporation • Evaporation is the change of state from liquid to gas at any temperature. • Note that evaporation is not the same as boiling.
Kinetic Theory of Evaporation • Molecules at surface of liquid have higher energy than the average kinetic energy of the other molecules when these molecules absorb energy from the surrounding air and objects. • These molecules gain energy and move faster and are thus able to overcome forces of attraction between the molecules and hence leaving behind less energetic ones. • When energy is lost for evaporation to take place, the remaining molecules have lower kinetic energy. Since temperature is directly proportional to average kinetic energy, the temperature of the remaining liquid decreases. (slightly) • As a result, the surface where evaporation has taken place feels cooler. • Conclusion: Evaporation causes cooling.
Some everyday effects and uses of evaporation. • Cooling effect on skin upon application of cologne • Evaporation of perspiration cools the body. • Wet clothes or puddles of water dries up in the open air. • Sponging someone who is having fever will cause the temperature to drop as the evaporation of the water from the person’s skin will cause cooling.
Factors affecting evaporation • Temperature • A liquid with a higher temperature will evaporate faster than one at a lower temperature. So heating will increase rate of evaporation • Humidity of surrounding air • Humidity refers to presence of water vapour in the air. The rate of evaporation decreases with increasing humidity. Rate of evaporation increases with decreasing humidity. • Surface area of liquid • Rate of evaporation increases with increasing surface area. The bigger the surface area, the faster the evaporation.
Factors affecting evaporation • Presence of wind • Rate of evaporation increases in the presence of wind. • Pressure • Rate of evaporation increases with decreasing atmospheric pressure. Wet objects dry faster at higher altitudes. • Nature of liquid • A liquid with a low boiling point has a higher rate of evaporation than a liquid with high boiling point.