Download
1 / 23
230 likes | 512 Vues
Energy Monitoring System. By Demarcus Hamm Advisor: Professor Cherrice Traver. Purpose. To advance Smart Grid concepts by analyzing data from an energy monitoring system. Project Goals. Real time wireless energy monitoring system in ECE labs Understand energy usage in ECE labs Time of day

E N D
Energy Monitoring System By Demarcus Hamm Advisor: Professor Cherrice Traver
Purpose • To advance Smart Grid concepts by analyzing data from an energy monitoring system.
Project Goals Real time wireless energy monitoring system in ECE labs • Understand energy usage in ECE labs • Time of day • Type of device • By room • Provide educational display for visitors and students
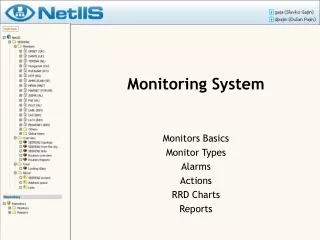
Design Requirements • Wireless • Stores data by day and time • Graphically display data • Visible display • More than one circuit • Expandability
Design Options Various plug in systems D.I.Y option Power Logic BCM Owl Cm119 TED 5000
TED System Components Current Transformers (CT) Measuring and Transmitting Unit (MTU) Gateway
TED System 4 MTUs per gateway and 2 CTs per MTU Footprints software Accuracy within 2% Power Line Carrier (PLC) Measures RMS real power 1 watt sensitivity
Display Requirements • ECE hall way • Internet access • Must be 2 inch depth or less • No user interactions • Stand by when no one is around
Display Choices • All in one computer • Tablet PCs • I-pad
Standby Mode Solution • Stand by when no one is present. • PIR motion sensor • Remote control
TED Footprints Pros Cons • Displays power factor, complex power, and real power • Graphically displays data • Can’t switch between display modes automatically • not very fine detail • No way to tell MTUs apart or values without user interaction
Software • “It’s Electric” modified • Switches between displaying by minute, hour, day, and month • Can be viewed off the Union Network • Faster than Footprints and has finer details
Communication Diagram HTML Raw Data
Electrical System Complication Home Panel Panels in the Lab • 2 phases and ground • 180 degrees between each phase • 3 phases and ground • 120 degrees between each phase
MTU Compensation • TED5000 support forum advice. • Cannot connect between phases. • Wait for 3 phase MTU
Future Work • Software improvements • Add additional sensors to the set up • Change MTUs for 3 phase • Incorporate the circuits in the N100 panel
Demonstration • http://antipasto.union.edu/~hammd/its-electric.html
Acknowledgements • Professor Traver • Jay Dulmaa • Gary Thomas • Professor Spallholz • Eric Truslow • Robert Tupelo-Schneck • Union College • My Mom