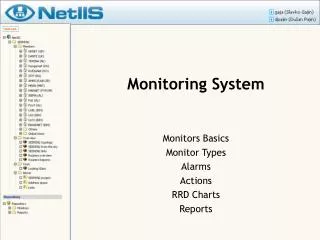
Monitoring System
Monitoring System. Monitors Basics Monitor Types Alarms Actions RRD Charts Reports. Monitoring System. Performance and Fault management Monitoring objects Monitors - permanent and periodic execution Reports - on-demand execution

Monitoring System
E N D
Presentation Transcript
Monitoring System Monitors Basics Monitor Types Alarms Actions RRD Charts Reports
Monitoring System • Performance and Fault management • Monitoring objects • Monitors - permanent and periodic execution • Reports - on-demand execution • Can be configured on Devices or Ports and in that context are executed
Monitors • Execution • status, period, timeout • Variables – keeps the measured values • Shown with an indexed number: • var(1), var(2) ... • var(0) – control variable
Monitor Types Basic types of Monitors are: • SNMP Monitor • Port Monitor • Traffic Monitor • Ping Monitor • NMAP Monitor • External Monitor Pre-defined and often used SNMP Monitors are: • Packets Monitor • BGP Monitor • CPU Load Monitor • System Memory Monitor
SNMP • Simple Network Management Protocol • SNMP basics • Community string • MIB and OIDs • Port Index • Suffix • How to access • any SNMP browser • Linux command: snmpwalk Expample: snmpwalk –v 1 –c public router-name
SNMP Monitor • Measurement of arbitrary SNMP variables - OID (Object Identifier) • If a device supports SNMP, then it is possible to get various information on device functioning and its services • OIDs database, so-called MIBs (Management Information Base) are either globally standardised or defined by the device manufacturer • The OIDs are configured as Monitor variables • SNMP Monitor is defined from the client application, while from the web interface, user can copy and paste already configured SNMP Monitors.
Router A Router B HOST 1
Traffic Monitor • Predefined SNMP monitor under Port object • Measures data traffic through the network interface • Variables: • var(1) and var(2) - Bytes per sec • var(3) and var(4) - bits per sec • RRD Chart for var(3) and var(4) • Input traffic - green colour • Output traffic - blue colour • Alarms can be set up to react to certain traffic intensity.
Input/Output traffic Traffic Monitor Router A Router X
Ping Monitor • Defined under Device object • Executes native ICMP ping service towards this device • Measures the results of ping command • 6 variables for packet delay and percentage of lost packets • Includes two RRD Chart objects • Ping Delay - measures the minimum and maximum delay of ping packets (var(1) and var(2)) • Ping Loss - measures the percentage of lost packets (var(6)) • Alarms for the Ping Loss percentage
Ping Monitor Packet Loss [%] Packet Delay [ms] Router X Router A
Ping monitor Packet Loss = 100 % Router A Router X
Port Monitor • Predefined SNMP monitor under Port object • Observes administrative and operational status of the network interfaces • var(1) – administrative status (1.3.6.1.2.1.2.2.7) • var(2) – operational status (1.3.6.1.2.1.2.2.8) • Children: • RRD Chart related to administrative and operational statuses • Alarms related to the operational status • Good Alarm – "var(2) == 1". Message: "Link is UP" • BadAlarm –"var(2) != 1". Message is: "Link is DOWN“ • Mail action is configured on Alarms with the same message.
Router B Port Monitor Packet Loss = 0 % DOWN UP Router A Router X
Net Port Monitor Router A Router X DOWN
NMAP Monitor • Measures the basic status of the network services • Checks whether the certain TCP or UDP port is available on the network device • The testing is done via native NMAP command on the NetIIS server • var(1) = true, port is open, • var(1) = false, port is closed • RRD Chart for var(1) draws two values: • 1 - open • 0 - closed • Alarms for events can be created on the Monitor when the port is open or closed, and certain Actions can be added.
External Monitor • Performs an arbitrary external command or a certain program on the operating system and checks the resulting values • It is possible to develop special programs or scripts, so-called Agents that take specific measures and actions • External Monitor, as any other Monitor, can contain Alarms and RRD Charts.
Pre-defined SNMP Monitors Pre-defined and often used SNMP Monitors are: • Packets Monitor • BGP Monitor • CPU Load Monitor • System Memory Monitor
Packet Monitor • Measures packets flow on the interface in a similar way to Traffic Monitor • Useful in the case of detecting anomalies in the network traffic • In the case of DoS attack or an attempt of virus expansion on the network, the network traffic (in bps) does not have to rise, but it will increase the number of packets • Two variables: • Var(1) - Interface In Packets (unicast) OID= .1.3.6.1.2.1.2.2.1.17 • Var(2) - Interface Out Packets (unicast) OID= .1.3.6.1.2.1.2.2.1.18 • Unit: Packets per second • RRD can be attached to the Monitor
BGP Monitor • Measures the status of BGP sessions • Monitor in variable var(1) returns the current status of the session with certain peer. • OID suffix is required - IP address of the BGP peer • .1.3.6.1.2.1.15.3.1.16.147.91.0.112 • RRD Chart assigned
CPU Usage Monitor • Three variables, the processor utilization in time intervals of 5s, 1min and 5min • Correspondent OID’s are not standardised, they are specified exclusively for Cisco devices and belong to the MIB hierarchy of the Cisco Systems • RRD Chart refers to the variable var(2), for processor utilization in the time interval of 1min • Note: For devices of other manufacturers it is possible to define similar Monitors if correspondent information is supported by SNMP
System Memory Monitor • Measures more variables, specified exclusively for Cisco devices • Requests input of suffixes to the defined OIDs • Processor memory - suffix .1 • interface memory - suffix .2, .3 or even higher value • RRD Chart refers to variables var(4) and var(8), for the memory usage in percentage.
Alarms • Perform failure notification • Defined within the Monitor • Observe Monitor values and comparing with configured thresholds • State of the Alarm • On – the condition is currently fulfilled • Off - otherwise • Two paired types: • Good Alarm – in status On - wished state • Bad Alarm – in status On - failed state • The “Alerts” page in Tools menu shows all Active Alarms.
Alarms attributes • Name. advised to have a uniform and generic name (Good alarm, Bad alarm) • Condition. Logical expression with the Monitor variables, in syntax: var(1), var(2) etc. • operations: "==", "!=", "<", "<=", ">",">=", "OR", "AND", "NOT". • Example: Conditions for detecting unusually low traffic on the Traffic Monitor: "var(3) < 100000 OR var(4) < 100000" • Delay. Values in seconds, time the Alarm conditions must be true in order to activate the action • Message. Message that is written in the Event Log. This is not a message sent to the user via email or SMS service. • Level. Critical level of the Alarm in the range from -10 to +10.
Alarms • Alarms activation event (changing to the state On) will be shown in the Event Log. • Additional notification - Action objects
Actions • Action that can be executed upon the activation of the Alarm. • Two types • Mail Action, sending e-mail messages to a selected User of User group • SMS Action, sending SMS messages to a selected User of User group • Attributes: • Name. It is possible to enter an arbitrary name of Action. • Text. Arbitrary text that is sent via email or SMS service. • Recipient. Recipient that the message is sent to, chosen from the list of existing Users or User groups
Action Note: Generic text message is recommended Note: Only one recipient can be chosen for one Action, i.e. individual User or User groups. If the message should be sent to another User it is recommended to add a new Action to chosen recipient (copy/paste in the Children box of the Alarm).
RRD Chart (MRTG) • Defined within the Monitor • Purpose: • archive values of Monitor variables during a certain time interval • draw these values in the chosen time interval • Up to two variables, refer to arbitrary Monitor variables: • green area • blue line • In View mode – • 4 charts with different: daily, weekly, monthly and yearly • Link on the top, opens the page in traditional MRTG format
Reports • Show the current state of the device SNMP variables on the user demand • Configuration from the Client application • SNMP variables and output forms are chosen • Web interface is for overview of the Report • Recognise existence of certain monitors and use them
Monitoring System Summary Monitors Basics Monitor Types Alarms Actions RRD Charts Reports

