Download

1 / 87
930 likes | 1.57k Vues
THE PHYSIOLOGICAL BASIS OF THE EKG. Dr. Guido E. Santacana Professor Dept. of Physiology. After this section you should be able to:. Differentiate between an intracellular action potential and the electrocardiogram as an extracellular recording.

E N D
THE PHYSIOLOGICAL BASIS OF THE EKG Dr. Guido E. Santacana Professor Dept. of Physiology
After this section you should be able to: • Differentiate between an intracellular action potential and the electrocardiogram as an extracellular recording. • Recognize the concept of the dipole and electrical potential vector and how it applies to the heart and EKG recording. • Recognize that the cumulative electrical activity of the heart forms dipoles or electrical potential vectors in different directions as the activation of the heart progresses. • Recognize that the multiple dipoles or electrical potential vectors generated by the heart produce the EKG recording. • Learn the 12 EKG Leads and their projection of the lead vectors in three orthogonal planes. • Understand how each EKG wave is generated using Lead I as an example. • Perform a simple sequential analysis of the EKG. • Learn the standards of the EKG recording paper. • Understand the origin of the Mean QRS Axis concept. • Using the Electrical Axis Circle of the heart learn to estimate Mean Electrical Axis. • Calculate the Mean QRS Axis by vector analysis using three or two standard leads. • Recognize the effect of left or right hypertrophy on the Mean QRS Axis. • Recognize the effect of left or right Bundle Branch Block on the Mean Electrical Axis. • Understand the concept of current of injury and its clinical implications. • Learn to estimate the site of an ischemic injury using the concept of the J Point.
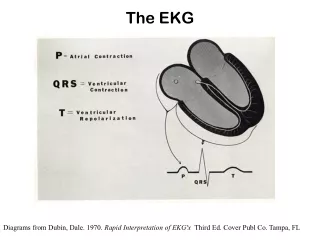
Action Potentials = Change in membrane potential occurring in nerve, muscle, heart and other cells The ECG is not an action potential but reflects their cumulative effect at the level of the skin where the recording electrodes are located.
- - + + THE DIPOLE CONCEPT METER C -2 0 +2 JAR - B + A D POS BATTERY NEG
Einthoven’s Original EKG Recorder String Galvanometer Schematic. String Galvanometer Based EKG Recorder. Patient with hands submerged in strong salt solution.
What are we looking at in the EKG waves? VOLTAGE!! As amplitude in Millivolts. Baseline at 0mv TIME!! Duration in fractions of a second
+ 0 - Atrial DepolarizationP wave (Lead I) A B Zero potential - P + Peak Potential
Ventricular Conducting System AV Node Bundle of His Left Bundle Branch Right Bundle Branch Left Posterior Fascicle P Septal fascicle P Left Anterior Fascicle P= Purkinje Fibers
Ventricular Septal Depolarization- the Q Wave A B + - + 0 Q -
Ventricular Depolarization-the R Wave R B A 3 - 4 + 0 - +
Ventricular Depolarization-The S Wave S B. A B. + + 0 - - A
QRS Configurations RSR’ QRS RS QR QS
T S Ventricular Repolarization- the T Wave - + B A + - 0 - +
INTERVALS AND SEGMENTS ! • PR Interval- Onset of P wave to onset of QRS. (.12-.20sec or 3-5 small squares) • QRS Interval-Beginning and end of QRS wave.(<.12sec duration or 3 small squares) • QT interval- Beginning of QRS to end of T wave.( Calculated as corrected QT = .42 sec) • ST segment ( no elevation or depression)
Limb Leads=Frontal Plane B A B B 60° 120° 0° A A - B + + A A -150° 90° B - - -30° B A + Chest Leads = Horizontal Plane B A
V6 Over the Left Ventricle V5 V4 V1 V2 V3 Over Interventricular Septum Over right ventricle The Chest or Precordial Leads
Projection of the 12 Lead EKG Vectors in Three Orthogonal Planes
Review of what each EKG Lead looks at. Y Z X Anterior Leads V1,V2,V3,V4 Left lateral Leads I, AVL,V5 V6 Inferior Leads II,III,AVF
MEAN QRS AXIS BASICS WHAT IS THE MEAN QRS AXIS? IT REPRESENTS THE AVERAGE DIRECTION OF THE INSTANTANEOUS FORCES GENERATED DURING THE SEQUENCE OF VENTRICULAR DEPOLARIZATION. NORMAL RANGE= -30 TO +90 DEGREES NORMAL VALUE= 59 DEGREES MORE - THAN -30 = LEFT AXIS DEVIATION MORE + THAN +90 = RIGHT AXIS DEVIATION
-90° 180° G 0° F E A B C D +90° Instantaneous and Mean Vectors ofVentricular Depolarization Mean Vector
Lead I Lead I 0° Lead II Lead III Lead III Lead II 120° REMEMBER EINTHOVEN 60° The Electrical Axis CircleWhere does it come from?
Lead I 0° Lead III Lead II 120° 60° The three Leads with a Common Center
THE ELECTRICAL AXIS CIRCLE! -90° -120° -60° aVR- -150° aVL - -30° +180° I- 0° Normal Range +30° +150° III- +120° II - +60° aVF- + 90°
Using the Circle to Estimate MEA -90° Lead II QRS UP TO ESTIMATE QRS AXIS -30° I-0° +180° +150° Lead I QRS UP II - +60° +90° -30° NORMAL AXIS +90°
The Isoelectric QRS and its use! aVL -30° +60 II Lead perpendicular to the isoelectric QRS
Cardiac Muscle Cardiac Muscle Cardiac Muscle ++++ ---------- ---------- ++++ ------------------ +++++ +++++ ------- ------- ++++++++++ Lead Lead Lead 0 0 - - + + 0 - + Meter Meter Meter Why is a Wave Biphasic? C B A Electrode Perpendicular to Direction of Depolarization
+ LA Lead aVL RA LV + Lead I RV + - Lead II + Why is Lead aVL Biphasic? Mean QRS
I I AVF Extreme Right axis deviation AVF Left axis deviation Right axis deviation. Normal axis I I AVF AVF Quick Estimation of Axis Deviation 0° Lead I +90° Lead AVF
Ventricular Hypertrophy 1 Limb Leads Precordial Leads
Ventricular Hypertrophy 2 Precordials S wave R exceeding 18mm R exceeding 26mm
Review of Vectors and Vectorial Analysis of the EKG Guido E. Santacana Ph.D. Professor Department of Physiology
Actual Direction (Resultant Vector) Graphical Representation y Wind 10 knots x 20 knots Basis for Vectorial Analysis The Boat example!!!
Higher Voltage Reading + - EKG (LEAD I): Projected Vectors for different Mean Electrical Axes Tilted Mean Vectors Partial Voltage Reading - + Parallel Mean Vectors LEAD I Perpendicular Mean Vectors No Voltage Reading LEAD I + - LEAD I NO PROJECTED VECTOR!!!!!
The Concept of the Projected Vector A=Mean Vector B=Projected Vector Figure A Figure B
Ventricular Depolarization Analysis Using the Projected Vectors .01 sec .02 sec .05 sec .035 sec .06 sec
Ventricular Repolarization Analysis Using the Projected Vectors
What is the Vectorcardiogram? It is simply the path marked by the positive ends of The depolarization vectors.
How to Plot the Mean Electrical Axis Using Two EKG Leads R wave only = 6mm or .6mv 6mm 6mm RS waves R= 8mm S= -2mm Total = 8-2=6mm or .6mv Mean Electrical Axis
Abnormal Ventricular Conditions That Cause Axis Deviation • Change in position of the heart in the chest. • Hypertrophy of one ventricle. • Bundle Branch Block.
Vectorial Analysis of Ventricular Hypertrophy -15° Left ventricular hypertrophy in a hypertensive heart. Reasons for deviation are LV mass and conduction time.
Vectorial Analysis of Right Ventricular Hypertrophy Notice also the High voltage EKG in Lead I 170° 170° RV Hypertrophy caused by Pulmonary Valve Stenosis
Vectorial Analysis in Bundle Branch Block Prolongued QRS due to Slower Conduction Time Through Block -50° left deviation Left axis deviation caused by a Left Bundle Branch Block
Vectorial Analysis in Bundle Branch Block Right Bundle Branch Block producing a right axis deviation. Again observe the longer QRS interval. Longer QRS intervals Can distinguish axis deviations due to BBBs vs. hypertrophies.
Low Voltage EKG Normal voltage between R wave and S wave should be from .5 to 2mv If the sum of the voltages in the QRS of leads I,II,III is greater than 4mv the EKG is considered as high voltage. Low voltage EKG due to myocardial infarction. Low voltage EKG is also caused by pericardial effusion, pleural effusion and pulmonary emphysema.