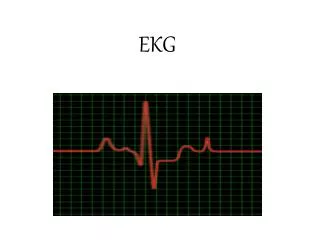
The Normal EKG
The Normal EKG. Eric J Milie D.O. Sinus Rhythm. P wave before every QRS complex P waves upright in II, negative in aVr Reproducibility of the R-R interval. Sinus Rhythm. Rate. <60bpm bradycardia >100bpm tachycardia Normal rate between 60 and 100 bpm

The Normal EKG
E N D
Presentation Transcript
The Normal EKG Eric J Milie D.O.
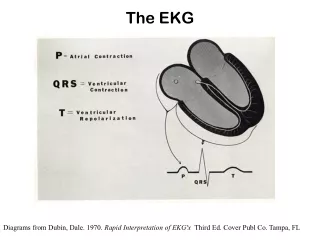
Sinus Rhythm • P wave before every QRS complex • P waves upright in II, negative in aVr • Reproducibility of the R-R interval
Rate • <60bpm bradycardia • >100bpm tachycardia • Normal rate between 60 and 100 bpm • If regular with <10% variation of R-R interval, termed “sinus arrhythmia”
Determining Rate • EKG grid made of large and small boxes • One large box= 0.2ms • One small box= 0.04ms
Determining Rate • Locate a QRS complex on a bold line (ie edge of large box) • If the next QRS complex is separated by one large box, the rate is 300, two boxes 150, three boxes 100, etc.
Rate • If rhythm is irregular, may use the “six second rule” to estimate the rate • Count the number of QRS complexes present in span of 30 large boxes, then multiply by 10 for an estimated heart rate
Axis • Normal QRS in an adult between –30° and +105° • Axis determined by finding “isoelectric” lead • I, aVF most important for quick estimate
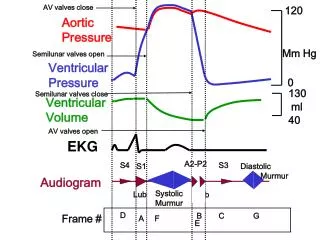
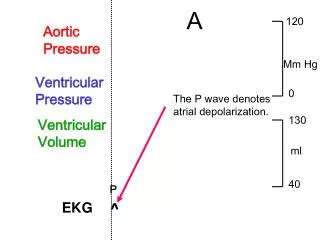
Intervals • P-R interval: beginning of p-wave to beginning of QRS; normal 0.12-0.2ms (3-5 small blocks) • Q-T interval: initiation of QRS complex to termination of T wave. Normal QT is 0.4 +/- 0.05ms • QT normal if <1/2 of the R-R interval
QRS • QRS complex represents the depolarization through the ventricles • Normal QRS duration between 0.08 and 0.12ms (2-3 small blocks)
S-T segment • Distance from the termination of the QRS complex to the initiation of the T-wave • Important to note its configuration (depression or elevation) • J-point: where ST segment “takes off” from QRS
T-wave • Should be of the same direction as the main deflection of QRS complexes in all leads • Positive in II, V3-V6 • Negative in aVR • Variable in other leads • No greater than 5mm in limb leads and 10mm in precoridal
Pathological Q waves • Significant Q-wave is >1mm wide OR >1/3the total vertical magnitude of the QRS • Must be present in contiguous leads for clinical significance • Small Q-waves common in I, ii, V5 and V6 and are considered “non-pathologic”
R wave progression • Transition from a mostly negative to a mostly positive QRS complex in the precordial leads should occur between V3 and V4 • Before V3 “early transition” • After V4 “poor R-wave progression”