Download
1 / 30
300 likes | 466 Vues
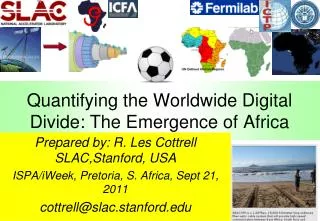
Quantifying the Worldwide Digital Divide: The Emergence of Africa. Prepared by: R. Les Cottrell SLAC,Stanford , USA ISPA/ iWeek , Pretoria, S. Africa, Sept 21, 2011 cottrell@slac.stanford.edu. Outline. Viewpoint from outside to Africa as a whole, focusing on R&E

E N D
Quantifying the Worldwide Digital Divide: The Emergence of Africa Prepared by: R. Les Cottrell SLAC,Stanford, USA ISPA/iWeek, Pretoria, S. Africa, Sept 21, 2011 cottrell@slac.stanford.edu
Outline Viewpoint from outside to Africa as a whole, focusing on R&E • Why does Africa’s Internet performance matter? • How do we measure performance? • What do we find? • What is happening and its impact • What’s next? • Conclusions
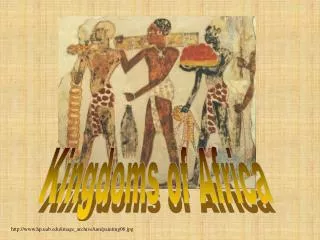
Africa is huge, diverse & dreadful access Fibres • Hard to get fibre everywhere • ~ 1B people, over 1000 languages,multi climates Capacity From Telegeography
Why does it matter • African scientists isolated • Lack critical mass • Need network to collaborate but it is terrible • Brain drain • Brain gain, tap diaspora • Blend in distance learning • Provide leadership, train trainers Tertiary Education from http://www.worldmapper.org/ Cartograms from: www.geog.qmw.ac.uk/gbhgis/conference/cartogram.html Internet Users 2002
How does the Internet help • A World Bank / IFC report says for every 10 percentage-point increase in high-speed Internet connections there is an increase in economic growth of 1.3 percentage points. April 2010. http://www.infodev.org/en/Article.522.html • Investment in information technology plays the role of a "facilitator" that allows other innovations to take place.http://findarticles.com/p/articles/mi_m1093/is_3_45/ai_86517828/
PingER Methodology very Simple Uses ubiquitous ping >ping remhost Remote Host (typically a server) Monitoring host Internet 10 ping request packets each 30 mins Once a Day Ping response packets Data Repositories@ SLAC FNAL & NUST in Pakistan Measure Round Trip Time & Loss 6
Coverage • Measurements from 1995 on reporting reliability & quality • ~ 99% of world’s population in monitored countries • Collaborations with NUST, Pakistan, FNAL & ICTP Italy • Monitors >70 in 23 countries – 4 in Africa: • Algeria, Burkina Faso, Egypt, S. Africa • Beacons ~ 100 • Remote sites (~740) – 50 African Countries
Losses • Low losses are good. • Losses are mainly at the edge, so distance independent • Losses are improving roughly exponentially, ~factor 100 in 12 years • Loss has Similar behavior to thruput: • Best <0.1%: N. America, E. Asia, Europe, Australasia • Worst> 1%: • Africa & C. Asia
Europe, E. Asia & Australasia merging Behind Europe: 5-6 yrs: Russia, L America, M East 9 yrs: SE Asia 12-14 yrs: India, C. Asia 18 yrs: Africa World Throughput Trends Derived throughput ~ 8 * 1460 /(RTT * sqrt(loss)) Mathis et. al Feb 1992 Africa in danger of falling even further behind. In 10 years at current rate Africa will be 70 times worse than Europe
Mean Opinion Score MOS) • Used in phone industry to decide quality of call • MOS = function(loss, RTT, jitter) • 5=perfect, 1= lowest perceived audible quaity • >=4 is good, • 3-4 is fair, • 2-3 is poor etc. Usable Important for VoIP From the PingER project http://www-iepm.slac.stanford.edu/pinger
Why does fibre matter: 2008 • GEOS (Geostationary Earth Orbit Satellite) • good coverage, but expensive in $/Mbps • broadband costs 50 times that in US, >800% of monthly salary c.f. 20% in US • & long delays min RTT > 450ms easy to spot • N.b. RTTs > 250ms v. bad for VoIP OK to US GEOS 500 400 300 Terrestrial 200 Minimum RTT (ms) Min- RTT from SLAC to African Countries 2010 100 0
Demo • Throughput vs IDI, multi-dimensional • Bubble size=population, x = IDI, y =throughput • Color = region • Play = time • Click to ID point, or region • Choose monitoring site, time aggregation, region • Change axes: choose metric, log vs linear • Plot sorted values, see time changes • http://www-iepm.slac.stanford.edu/pinger/pinger-metrics-motion-chart.html • Google motion chart widget: • http://documents.google.com/support/spreadsheets/bin/answer.py?answer=91610 • Data from US census bureau (population), Internet world stats (users/country), ITU (DOI), Wikipedia (CPI), UNDP (HDI)
Compare PingER with ICT Development Index (IDI) from ITU • IDI = ICT readiness + usage + skills • Readiness (infrastructure access) • phone (cell & fixed) subscriptions, international BW, %households with computers, and % households with Internet access • Usage (intensity of current usage) • % population are Internet users, %mobile, and fixed broadband users • Skills (capability) • Literacy, secondary & tertiary education www.itu.int/ITU-D/ict/publications/idi/2009/material/IDI2009_w5.pdf
PingER throughput & IDI • Positive correlation between PingER throughput & IDI, especially for populous countries • PingER measurements automatic • No army of data gatherers & statisticians • More up to date • IDI 2009 index for 2007 data • Good validation • Anomalies interesting PingER Normalized Throughput IDI index
What is happening 2008 • Up until July 2009 only one submarine fibre optic cable to sub-Saharan Africa (SAT3) costly (no competition) & only W. Coast • 2010 Football World Cup => scramble to provide fibre optic connections to S. Africa, both E & W Coast • Multiple providers = competition • New Cables: Seacom, TEAMs, Main one,EASSy, already in production 2012 manypossibilities.net/african-undersea-cables
Plans for New Sub-SaharanUndersea Cables to Europe and India by 2011 Main1 on YouTube: http://www.youtube.com/watch?v=pzbAS1lXW1A
Impact: RTT etc. • As sites move their routing from GEOS to terrestrial connections, we can expect: • Dramatically reduced Round Trip Time (RTT), e.g. from 700ms to 350ms – seen immediately • Reduced losses and jitter due to higher bandwidth capacity and reduced contention – when routes etc. stabilized • Dramatic effects seen in leading Kenyan & Ugandan hosts 720ms • RTT improves by factor 2.2 • Losses reduced • Thruput ~1/(RTT*sqrt(loss)) up factor 3 Big jump Aug 1 ’09 23:00hr Median RTT SLAC to Kenya 325ms • Bkg color=loss Smoke=jitter
From ICTP, Trieste, Italy • Even Bigger effect since closer than SLAC • Median RTT drops 780ms to 225ms, i.e. cut by 2/3rds (3.5 times improvement) Seems to be stabilizing Still big diurnal changes Aug 2nd
Other countries 750ms 450ms • Angola step mid-May, more stable • Zambia one direction reduce 720>550ms • Unstable, still trying? • Tanzania, also dramatic reduction in losses • Ugandainland via Kenya, 2 step process • Rwanda Sep 25 • Many sites still to connect SLAC to Angola Aug 20 SLAC to Zambia Both directions? 1 direction Sep 27 SLAC to Tanzania SLAC to Uganda Both directions 1 direction
Next Steps: Going inland • Connect up the rest of the sites & countries • Extend coverage from landing points to capitals and major cites • Need fibre connections inland • They exist • Most universities located nearby Inter Africa fibre network www.ubuntunet.net/fibre-map Central
Next Steps: Beyond Fibre’s reach • Once one has the basic insfrastructure in place (fiber to cities) and can carry the traffic for millions of users then one need the last mile to connect up those millions of users with their cellphones etc.. • In areas where fibre connections are not available (e.g. rural areas), the main contenders appear to be: • wireless, e.g. microwave, cellphone towers, WiMax etc., • Low Earth Orbiting Satellites (LEOS) for example Google signed up with Liberty Global and HSBC in a bid to launch 16 LEOS satellites, to bring high-speed internet access to Africa by end 2010, • gigaom.com/2008/09/09/google-invests-in-satellite-based-internet-startup/ • and weather balloons • www.internetevolution.com/author.asp?section_id=694&doc_id=178131& • http://crossedcrocodiles.wordpress.com/2009/06/26/undersea-broadband-fiber-optic-cables-to-africa/
Next Steps: Let’s get together • Get leaders such as universities, academic establishments (teach the teachers) to get togeher to form NRENs for country • Bargain for cheaper rates • BW most expensive worldwide ($4K/Mbps), dropping factor 2 in year • NRENS get together to create International eXchange Points (IXPs) • Avoid intercountry links using expensive intercontinental links via Europe and the US • Ubuntunet now connected to GEANT.
Example: Multiple routes important • Not only for competition • Need redundancy • Mediterranean Fibre cuts • Jan 2008 and Dec 2008 • Reduced bandwidth by over 50% to over 20 countries • New cable France-Egypt Sep 1 ‘10 Lost connection 1000ms 200=>400msms SLAC – www.tanta.edu.eg 50% 20% 0%
Example: N. African uprisings Jan ‘11 • Impact varied: start time, recovery time, after effects • Egypt University Network (EUN) down least time • NARSS via Alternet->Italy->Egypt, Helwan &EUN via PCCW Global • Libya first went dark 06:00 Feb 19 for 3 days, then again on Mar 4th more permanently • Algeria, Morocco, Tripoli not noticeable NARSS (Cairo) 23:59 Jan 27 Helwan (Cairo) 12:00 Jan 27 EUN (Cairo) 23:59 Jan 28
Example: DRC (Democratic Republic of Congo) • WACS cable landed Moanda (DRC) & Point Noire (Congo Brazzaville) Feb ’11 • Already 10Gbps fibre to capital Kinshasa (637km) • Fibre under construction to Brazzaville and • Kinshasa across R. Congo to Brazzaville • DRC NREN plan to connect 15 Kinshasa universities by fibre by Dec 2011 • Today UniKin has 26K students has 8 public IP addresses 1.5Mbps download, 512kbps upload to Internet • Big changes are in store
Conclusions • Many problems: electricity, skills, disease, wars, poverty, conflict, protectionist policies, corruption • Current providers (cable and satellite) have a lot to loose • Many of these have close links to regulators and governments (e.g. over 50% of ISPs in Africa are government controlled) • Attractions: enormous untapped, youthful market • Internet great enabler in information age • The fibre coming to Sub-Saharan Africa has great potential to help catchup & leap forward • Still last mile problems, and network fragility • Leap frog: wireless replaces wired; OLPC/net computer, smart phones, tablets (iPADs) replace non mobile • Africa international bandwidth capacity increased 14 fold 2006-2010, prices are coming down, not as fast as hoped • Yet still a long way to go: all Africa combined has less than one third as much international capacity as Austria alone.
More Information • Case Study: • confluence.slac.stanford.edu/display/IEPM/New+E.+Coast+of+Africa+Fibre • Ubuntunet Alliance • www.ubuntunet.net/ • EU study on deploying regional backbone connecting NRENs • http://www.feast-project.org/documents/ • MANGO-NET (Made in Africa NGO NETwork) • www.isgtw.org/?pid=1001999 • Undersea fibre cables • manypossibilities.net/african-undersea-cables • Cross country fibres • www.cablemap.info
Loss Quality Vs. Population in 2008 vs. 2001 2001 Loss Quality vs Population Jan 2010 – Dec 2010 In 2001, only ~20% of the world had an Acceptable or Better Packet Loss Rate [49% unmeasured]. By 2010 this had improved to ~93%. What matters as much now is throughput.