Download
1 / 9
440 likes | 1.59k Vues
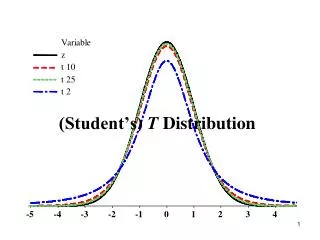
(Student’s) T Distribution. Z vs. T. Unknowns. For Normal populations, the appropriate standardized variable for making inferences (confidence intervals; P -values for tests) is the T statistic.

E N D
Z vs. T Unknowns. For Normal populations, the appropriate standardized variable for making inferences (confidence intervals; P-values for tests)is the T statistic. Many applications involve making conclusions about an unknown mean. Because a second unknown, , is present, the Z statistic isn’t useful in practice. The known (sample) values, and the T distribution with (n – 1) Degrees of Freedom (DF), are used to make conclusions about .
Degrees of Freedom (for Error) Typically abbreviated DF or DFE. Always a whole number. Larger DF implies more information about variability. Generally equal to the number of observations minus the number of estimated means. DF for Error appears in the denominator of standard deviation calculations. n – 1 = DF
T Distributions There is a different T distribution for every whole number. The whole number that indexes the T distribution for an application is the degrees of freedom. Important critical values are tabled: Table A-3. Symmetric about 0. For large DF,T is very similar to Z. (For smaller DF) T distributions have (considerably) more probability in the tails and less in the middle. If the table omits the DF for an application, either interpolate or use the next smaller DF available.
Example For T5 find the probability of T above 1.476. ANS: 0.10
Example For T5 find the probability of T below -2.015. ANS: 0.05
Example For T5 find the probability of T between -2.571 and +2.571. ANS: 0.95 0.025 0.025
Other Populations As long as the sample size is sufficiently large, use of the T statistic is warranted for non Normal populations.