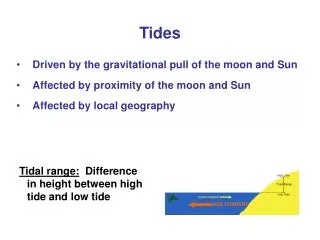
Predicting Tides in the Bay of Fundy: A Hydrodynamic Model Approach
180 likes | 311 Vues
This study presents a detailed analysis of predicted tides in the Bay of Fundy, utilizing advanced hydrodynamic modeling techniques developed by the Ian Church Ocean Mapping Group at the University of New Brunswick. The research includes tidal range, phase analysis, and data from various tidal stations from Grand Manan to Saint John. The hydrodynamic model is validated with observational data, providing insights into tidal amplitudes, phases, and non-tidal residuals. This comprehensive modeling aids in the establishment of vertical datums essential for hydrographic surveys and maritime operations.

Predicting Tides in the Bay of Fundy: A Hydrodynamic Model Approach
E N D
Presentation Transcript
Predicted Tides from Hydrodynamic Models Ian Church Ocean Mapping Group University of New Brunswick US Hydro 2007 The Sixth International Discussion Group Meeting on Uncertainty Management in Hydrography
Bay of Fundy Saint John St. Andrews Eastport Grand Manan Digby
Tidal Range and PhaseSurvey Operations up to 2006 St. Andrews Maces Bay 8 Minute Phase Lag Through Letite Passage Passamaquoddy Bay Deer Island 2.8 m 2.3 m The Wolves M2 Amplitude and Phase WebTide Scotian Shelf Model 1 Minute Phase Contours Eastport Campobello Island 0 km 10 km 20 km
White – 0.2m range contours. Black 1 minute phase ranges. Operations 2007 Grand Manan M2 Amplitude and Phase WebTide – Scotian Shelf Model Contours: 1 Minute Phase 0.2 m Amplitude
Reduce Sounding Data • Tides: • Observed Tides • Predicted Tides • Hydrodynamic Model • Sounding Datums: • MSL / Geoid • Local Chart Datum • Discrete Steps? • Linear Transition? • Polynomial Interpolation? • Co-Tidal Interpolations • Scaled Multiple of the Local Harmonic Constituents We wish to establish a vertical datum which represents an offset from mean-sea-level, below which “the tide rarely falls”.
Moncton +45 minutes +26.2ft • Tides in the Bay of Fundy • wrt Saint John • Options: • Use Predicted Tides • Interpolate Between Stations Hopewell Cape +8 minutes +18.5ft Cape Enrage +5 minutes +13.2ft Saint John Primary Port 0 minutes Mean Tide – 25.3ft (7.7m) Large Tide – 29.6ft (9.0m) Advocate Harbour +5 minutes +10.3ft St. Martins +6 minutes +6.3ft St. Stephen +8 minutes -1.0ft Back Bay -7 minutes -3.8ft Partridge Is. -13 minutes -0.3ft St. Andrews +8 minutes -2.5ft Margaretsville -18 minutes +7.6ft Dipper Harbour -2 minutes -2.6ft EastPort ME USA Primary Port North Head -5 minutes -5.5ft Welshpool +1 minutes -4.2ft Digby -16 minutes +1.0ft Source: Canadian Tide and Current Tables Atlantic Coast and Bay of Fundy Outer Wood Island -15 minutes -9.5ft Brier Island -44 minutes -8.3ft
Hydrodynamic Model Bay of Fundy • A Digital Replica of the Water Within a Region • Created using a Coastline and Seafloor Bathymetry • Driven Using Topex-Poseidon Tidal Observation Data and Tide Gauge Data Nova Scotia Maine Scotian Shelf Model • A TIN of the Scotian Shelf, Georges Bank and the Bay of Fundy DUPONT, F.; C.G. HANNAH, D.A. GREENBERG, J.Y. CHERNIAWSKY and C.E. NAIMIE. 2002. Modelling system for tides for the North–west Atlantic coastal ocean. Can. Tech. Rep. Hydrogr. Ocean Sci. 221:vii+72pp.
Hydrodynamic Model • Provides a Tidal Prediction for any point within the TIN • Predicted Amplitude and Phase • Tidal Currents • Accuracy • 0.15 metres Amplitude • 5 deg Phase Dupont, F., C. G. Hannah, D. Greenberg. Modelling the sea level in the upper Bay of Fundy. Atmosphere-Ocean 43(1) 2005, 33-47.
Non-TidalResiduals Saint John Eastport Cutler North Head Digby Brier Island Yarmouth Meteorological Effects – Pressure, Wind/Wave Build up, etc.
0km 25km 50km 100km Cutler Naval Base - Maine Eastport - Maine • All Tide Stations within the Area Display Very Similar Non-Tidal Residuals • Non-Tidal Residuals from a Single Station can be Examined Digby – Nova Scotia Brier Island – Nova Scotia
Model Sounding Datum • Sounding Datum that Varies Constantly and Smoothly throughout the Entire Model Domain • Based off the Tidal Prediction at Each Node within the TIN Develop Sounding Datum Based on Hydrodynamic Model Bay of Fundy Nova Scotia Maine
Sounding Datum • Relate ISLW to Existing Chart Datum • Determine Multiplier at Local Tide Stations • Datum = Multiplier * ISLW • Indian Spring Low Water • Suggested by Sir George Darwin for Indian Waters • ISLW = MSL – (M2+S2+K1+O1) K1 M2 O1 S2 ISLW Datum Great Britain Hydrographic Office (1969). “Tides and Tidal Streams.” Chapter Two in Admiralty Manual of Hydrographic Surveying, Vol. 2, Somerset, England, 118pp.
Sounding Datum • Datum = F*S where, • If (S < 2 m) F = 0.85 • If (S > 5 m) F= 1.0 • Else F is linearly interpolated between the above values. • Hannah, DFO • S = M2+N2+S2+K1+O1 O1 N2 K1 M2 S2 Datum
Comparison to CHS ZOBay of Fundy RMS = 0.22 m RMS = 0.30 m 38 CHS Tide Stations
Application • Tidal Power Stations • Perform Repeat Surveys Prior to Installation to Observe Existing Sediment Transport Passamaquoddy Bay Deer Island Eastport Campobello Island http://www.rgu.ac.uk/research/innovation/page.cfm?pge=7560
Summary • Provides a Smooth Sounding Datum Throughout the Model • Uniform Transitions Between Datasets • Datum Based on Varying Predicted Tides Throughout the Region Resolve Tides from Hydrodynamic Model + Non Tidal Residuals Sounding Datum based on Hydrodynamic Model
Thank You Ian Church
Multibeam Sonar Swath Day 1 = Black Day 2 = Red