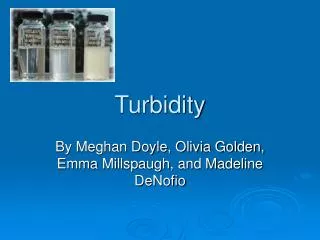
Turbidity
Turbidity. Fall 2010 Nikki Byrd. What is turbidity?. Measure of water clarity Degree to which water is scattered and absorbed Causes Heavy rainfall, storms Algal blooms Flocculation in estuaries Waste discharge Run-off Land changes Native vegetation and agriculture POM/CDOM.


Turbidity
E N D
Presentation Transcript
Turbidity Fall 2010 Nikki Byrd
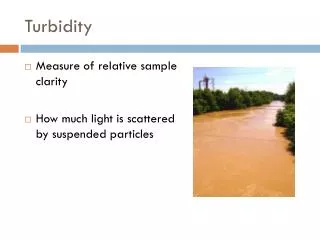
What is turbidity? • Measure of water clarity • Degree to which water is scattered and absorbed • Causes • Heavy rainfall, storms • Algal blooms • Flocculation in estuaries • Waste discharge • Run-off • Land changes • Native vegetation and agriculture • POM/CDOM
Why does turbidity matter? • High turbidity effects • Drinking water • Correlation with high levels of pathogens • Reduced light penetration • Increased Kd • Photosynthesis • Dissolved oxygen • Water temperature • Dissolved oxygen
Measuring turbidity • Secchi disk • Accuracy • Nephelometers • Common • Measures scattering • 90° from an incident beam of light • Scattering is proportional to turbidity • Relative units: NTU • More scattering = higher turbidity
Conclusions • Cruise 1 • Higher than LCFRP • No correlation with class average • Cruise 2 • Higher than LCFRP • Close to class average • Turbidity maximum around M 35, M42 for 1st cruise, M54 for 2nd cruise • Decrease with salinity • Dilution • Direct relationship with Kd for both cruises, surface and deep