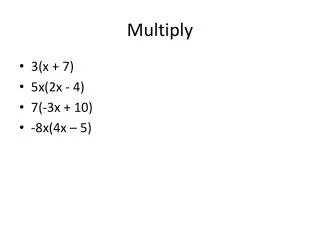
Multiply each expression.
Learn how to find real zeros and relative extrema of polynomial functions with step-by-step instructions and examples. Practice solving for x-intercepts and mastering leading coefficient tests. Discover how to describe graph behaviors and identify peaks in functions.


Multiply each expression.
E N D
Presentation Transcript
Students, Take out your calendar and your homework. Take out your spiral notebook and Complete the DNA.Use your notes if necessary. Find the x-intercepts of the following functions. (Hint: set each function equal to zero and solve.) Multiply each expression.
Real Zeros of Polynomial Functions If f is a polynomial function and a is real, the following are equivalent:
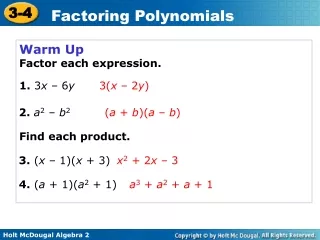
(4) a) Find all real zeros of Hint: multiply by – 4 b) Find the relative extrema of f. The relative minima and maxima.
Leading Coefficient Test 1. When n is odd: If the leading coefficient is positive If the leading coefficient is negative Then the graph falls to the left and rises to the right. Then the graph risesto the left and fallsto the right.
Leading Coefficient Test 2. When n is even: If the leading coefficient is positive If the leading coefficient is negative Then the graph risesto the left and right. Then the graph fallsto the left and right.
Describe the left-hand and right-hand behavior of the graph of each function. The degree is odd and the leading coefficient is positive. The graph falls to the left and rises to the right. The degree is even and the leading coefficient is negative. The graph falls to the left and right.
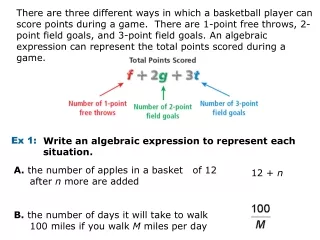
The numbers of new accounts opened at a credit union in the years 2001 and 2006 can be approximated by the model: with t = 11 corresponding to 2001. Using this model, determine the year in which the number of new accounts opened was greatest.