Download
1 / 31
310 likes | 788 Vues
Summaries of Affymetrix GeneChip probe level data . By Rafael A. Irizarry PH 296 Project, Fall 2003 Group: Kelly Moore, Amanda Shieh, Xin Zhao. 5´. 3´. Gene Sequence. Multiple oligo probes. Perfect Match. Mismatch. Microarrays: Many Probes for One Gene.

E N D
Summaries of Affymetrix GeneChip probe level data By Rafael A. Irizarry PH 296 Project, Fall 2003 Group:Kelly Moore, Amanda Shieh, Xin Zhao
5´ 3´ Gene Sequence Multiple oligo probes Perfect Match Mismatch Microarrays: Many Probes for One Gene
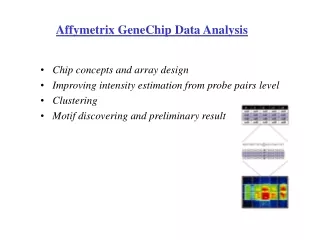
Affymetrix GeneChip Arrays • High density oligonucleotide array technology is widely used in many areas of biomedical research for quantitative and highly parallel measurements of gene expression • Most popular technology for quantitative and highly parallel measurements of gene expression is Affymetrix GeneChip arrays • Used to obtain gene expression measures by summarizing probe level data
Affymetrix Chips Each gene or portion of a gene is represented by 16 to 20 oligonucleotides of 25 base-pairs, i.e., 25-mers. A mRNA molecule of interest (usually related to a gene) is represented by a probe set composed of 11-20 probe pairs of these oligonucleotides. • Probe: a 25-mer. • Perfect match (PM): A 25-mer complementary to a reference sequence of interest (e.g., part of a gene). • Mismatch (MM): same as PM but with a single homomeric base change for the middle (13th) base (transversion purine <->pyrimidine, G <->C, A <->T) . • Probe-pair: a (PM,MM) pair. • Probe-pair set: a collection of probe-pairs (16 to 20) related to a common gene or fraction of a gene. • AffyID: an identifier for a probe-pair set. • The purpose of the MM probe design is to measure non-specific binding and background noise. After scanning the arrays hybridized to labeled RNA samples, intensity values PMij and Mmij are recorded for arrays i = 1,…., I and probe pairs j=1,…, J, for any given probe set.
Affymetrix GeneChips • After scanning the arrays hybridized to labeled RNA samples, intensity values PMij and MMij are recorded for arrays i=1,…,I and probe pairs j=1,…,J for any given probe set • Probe intensities summarized for each probe set to define a measure of expression
Combining Measurements across Arrays • Data on G genes x n arrays: G x n genes-by-arrays data matrix • Expression measure: M = log2( Red intensity / Green intensity) Array1 Array2 Array3 Array4 Array5 … Gene1 0.46 0.30 0.80 1.51 0.90 ... Gene2 -0.10 0.49 0.24 0.06 0.46 ... Gene3 0.15 0.74 0.04 0.10 0.20 ... Gene4 -0.45 -1.03 -0.79 -0.56 -0.32 ... Gene5 -0.06 1.06 1.35 1.09 -1.09 ... ….. … … …
Three Competing Models • Affymetrix MicroArray Suite (MAS) • MAS versions 4, and 5 • dChip • Li and Wong, HSPH • The log scale robust multi-array analysis (RMA) • Bioconductor: affy package. • by Bolstad, Irizarry, Speed, et al
1st Version of Affymetrix Analysis Software • Used an average over probe pairs of differences: PMij-MMij, j=1,…J for each array i • A model for this Average Distance (AD) is: PMij - MMij =θi+εij, j=1,…,J where θi is the expression quantity on array I • AD is an appropriate estimate of θiif the error term εij has equal variance for j=1,…J This assumption does not hold for GeneChip probe level data since probes with larger mean intensities have larger variances
Model 1: MicroArray Suite – Version 5MAS 5 • MicroArray Suite version 5 uses where • MM* is an adjusted MM that is never bigger than PM • Tukey biweight is a robust average procedure with weights: f(x)=c2/6[1-(1-x2/s2) 3]; |x|<c PM-MM values for probe pairs
Model 2: Robust Multi-chip AnalysisdChip • Each probe responds roughly linearly • over a moderate range • some probes are outliers • Variation of a specific probe across multiple arrays could be considerably smaller than the variance across probes within a probe set. To account for this strong probe affinity effect, the following model was proposed. • Multiplicative Model: • The probe affinity effect is represented by j. • When multiple arrays are available, the expression index is defined as the maximum likelihood estimate of the expression parameters θi. • Robust Fit: • identify outliers by heuristic – remove • standard robust method – iteratively re-weighted least squares • The software package dChip can be used to fit this model and obtain what we refer to as the dChip expression measure.
Model 3: A log scale linear additive model RMA • Appropriately removing background and normalizing probe level data across arrays results in an improved expression measures motivated by a log scale linear additive model: • T represents the transformation that background corrects, normalizes, and logs the PM intensities. • represents the log2 scale expression value found on array i. • represents the log scale affinity effects for probes j. • represents error. • A robust linear fitting procedure, such as median polish, was used to estimate the log scale expression values . • The resulting summary statistic is referred to as RMA. • Recent results suggest that subtracting MM as a way of correcting for non-specific binding is not always appropriate. Until a better solution is proposed, simply ignoring these values is preferable.
Assessment Criteria • Data from spike-in and dilution experiments to conduct various assessments on the MAS 5.0, dChip and RMA expression measures. • The measures of expression are assessed according to three criteria: (i) the precision of the measures of expression, as estimated by standard deviations across replicate chips; (ii) the consistency of fold change estimates based on widely differing concentrations of target mRNA hybridized to the chip; (iii) the specificity and sensitivity of the measures’ ability to detect differential expression, presented in terms of receiver operating characteristic (ROC) curves.
Dilution Study Two sources of cRNA, human liver tissue and a central nervous system cell line (CNS), were hybridized to human arrays (HG-U95A) in a range of dilutions and proportions. Data from six groups of arrays that had hybridized liver and CNS cRNA at concentrations of 1.25, 2.5, 5.0, 7.5, 10.0 and 20.0 µg were studied. Five replicate arrays were available for each generated cRNA (n=60 total). Spike-in Studies Different cRNA fragments were added to the hybridization mixture of the arrays at different pM concentrations. The cRNAs were spike-in at a different concentration on each array arranged in a cyclic Latin square design with each concentration appearing once in each row and column. Two different data sets from: (i) Affymetric (ii) GeneLogic Study Design
Study DesignAffymetrix spike-in experiment This data set consists of 3 technical replicates of 14 separate hybridizations of 42 spiked transcripts in a complex human background at concentrations ranging from 0.125pM to 512pM. Thirty of the spikes are isolated from a human cell line, four spikes are bacterial controls, and eight spikes are artificially engineered sequences believed to be unique in the human genome.
Resultsmeasure of precision: R2 • A common measure of precision to compare replicate arrays is the squared correlation coefficient, R2. • For the dilution data, average R2 is computed over all 120 pairs of replicates (2 tissues * 6 concentrations * 10 different pairs in each group of 5 replicates). • MAS5.0: 0.990 dChip: 0.993 RMA: 0.995 • The differences between the R2 averages are statistically significant. RMA outperformed dChip, which in turn outperformed MAS5.0. • However, because of the strong probe affinity effect, GeneCHip arrays will in generall have R2 values close to 1. The gene-specific log expression SD across replicates is a more informative assessment.
Resultsmeasure of precision: gene-specific SD • The SD of the expression values (log2 scale) across the five replicated in each of the 6 concentration groups were computed. • Smooth curves were then fitted to scatter plots of these SD values versus average expression value (log2 scale). The above plot showed that RMA had a smaller SD at all levels of expression.
Results: signal detection • To insure that signal detection was not sacrificed for the gains in noise reduction, the ability of the expression measures to detect the increase in cRNA across the concentration groups was examined. • The average slope, over all genes, of the expression versus concentration lines on the log-log scale was computed as a summary of signal detection. • Liver cells: MAS5.0: 0.65 dChip: 0.59 RMA: 0.67 • CNS cells: MAS5.0: 0.63 dChip: 0.58 RMA: 0.67 • Since every fold increase in concentration of the target sample should give rise to the same fold increase in an expression measure, a line fitted on the log-log scale should have slope 1. For reasons we don’t understand, all three measures lead to slopes well below 1, but on the criterion, RMA and MAs5.0 performed similarly, while dChip had a slightly smaller signal. • RMA has similar accuracy but better precision than the other two summaries.
Resultsmeasure of consistency: fold change across concentrations • Observed fold change in expression measures is used to assess differential expression. • While the Affymetrix protocal calls for 15 μg of RNA, in practice the amount of target mRNA available for the hybridization reactions can differ greatly depending on the cells or tissue type under study. • Because fold change is a relative measure, estimates should be independent of the amount of RNA that is hybridized to the arrays. It is desirable to have estimated fold changes in expression largely independent of the amount of target mRNA used. • The correlation of fold change estimates from the different concentrations was computed for each of the three expression measures. MAS5.0: 0.85 dChip: 0.95 RMA: 0.97 • RMA provides more consistent estimates of fold change.
Resultsmeasure of consistency: fold change across concentrations Log (base 2) fold change estimates of gene expression between liver and CNS samples computed from arrays hybridized to 1.25 μg of cRNA were plotted against the same estimates obtained from arrays hybridized to 20 μg for all three measures. RMA provides more consistent estimates of fold change.
Resultsspecificity and sensitivity • Successful fold change analysis will detect all and only genes that are differently expressed due to biological variation. • In the spike-in experiments arrays were hybridized to the same background, successful differential expression analyses should identify only the spiked-in genes as being differentially expressed. • 10 pairs of arrays were chosen at random from both Affymetrix and GeneLogic spike-in studies. For each of these pairs , estimates of fold change were computed using the three expression measures. Then, for a large range of cut-off values, the number of false positives and the number of true positives were computed. • ROC curves were created by plotting the true positive rates (sensitivity) versus false positive rates (1-specificity).
Resultsspecificity and sensitivity • Area under ROC curves can be used to compare specificity and sensitivity of competing tests. • The ROC curves below showed that the RMA curves dominated the dCHip and MAS5.0 curves. Thus the differential expression calls obtained with RMA have higher sensitivity and specificity then those obtained with the other two measures.
Resultsspecificity and sensitivity • To understand why fold change analysis using RMA has better sensitivity and specificity, we looked at versus plot for expression Xg and Yg from two arrays being compared for all genes, g=1,…, G. • M vs. A plots are useful in the way that log fold change (the quantity of most interest) is represented on the y-axis and average absolute log expression (another quantity of interest) on the x-axis. •The plots on next slides are produced by selecting one array from one of the Affymetrix spike-in experiments to use as a reference and then computing Mg and Ag for the comparisons of that array with all other arrays in the experiment using MAS5.0, dChip, and RMA.
Resultsspecificity and sensitivity In these plots, the colored numbers represent the log2 fold change in concentrations of spiked-in genes. The red points represent non-spiked-in genes with a fold change larger than 2. Using RMA, the plot has fewer red points, showing smaller variance, especially for genes with lower absolute expression. This resulted in better detection capability of genes spiked-in at different concentrations.
Resultsspecificity and sensitivity • The color box plots of fold change estimates demonstrated that RMA produces fold changes closer to 1 for genes that are not changing than those for MAS5.0 , with those for dCHip being in between. • The interquartile ranges of log2 fold change for equivalently expressed genes were 0.92, 0.22 and 0.19 for MAS5.0, dChip and RMA, respectively.
Conclusions • Through the analyses of dilution and spike-in data sets it was shown that RMA performs better than MAS 5.0 and dChip, specifically: • RMA has better precision • RMA provided more consistent estimates • RMA provided higher specificity and sensitivity when using fold change analysis to detect differential expression • This greater sensitivity and specificity of RMA in detection of differential expression provides a useful improvement for researchers using the Affymetrix GeneChip technology
Improvement in Models • Affymetrix Suite gets better every year • MAS 7 is expected to be a multi-chip model • MAS 5.0 estimation does a reasonable job on probe sets that are bright • Metabolic and structural genes • These are most often reported in papers • dChip and RMA do better on genes that are less abundant • Signalling proteins • transcription factors
Introduction for practice project • Goals:practice our data set using RMA and MAS 5 normalization methods and compare the expression results to test the conclusion of this paper. • Gene chips:HG-U133A/B Affymetrix GeneChip set • Study design: case-control study Exposed:benzene-exposed shoe workers ,6 samples Controls: clothing factories ‘ workers, 6 samples Matched on: gender ,age and smoking Samples: 6 pairs’ matched people ; gene: lymphocyte RNA • Output: 2,129 genes was significantly different in people exposed to high levels of benzene compared to matched unexposed subjects. Expression of 964 of these genes was decreased and 1165 were increased.(RMA method)
Figure1 Measure of precision: gene-specific SD • We compared the exposed group(x1) vs unexposed group(x2) expression value Ag=1/2(log(x1)+log(x2)) in genechipA to its Standard deviation here. • Smooth curves were then fitted to scatter plots of these SD values versus average expression value (log2 scale). • It is showed that RMA had a smaller SD than MAS 5 that means the precision is better.
Figure 2 M vs A plot The plots are produced by unexposed(x1)/exposed(x2) arrays in both chip A and B computing Mg and Ag. Using RMA, shows smaller variance as compared to MAS 5.0 which also supports results discussed in the paper.
Figure 3Boxplot of log fold change (M) in RMA(1) and MAS5(2) • RMA produces fold changes closer to 1 for genes that are not changing than those for MAS5.0. • The interquartile ranges of log2 fold change for equivalently expressed genes were 0.37 and 0.19 for MAS5.0 and RMA, respectively.
Remarks • We were able to support the results,according to the criteria outlined in the paper by using the RMA and MAS 5.0 techniques on our own data. • We also found that as compared to MAS 5.0, • RMA has better precision • RMA provided more consistent estimates • RMA provided higher specificity and sensitivity