Download
1 / 15
350 likes | 1k Vues
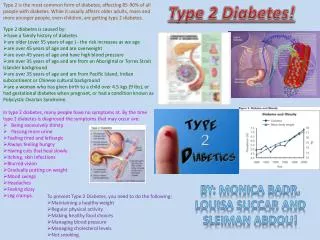
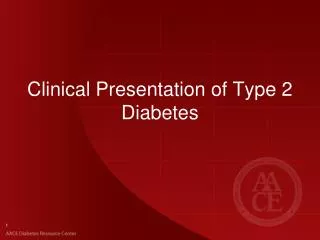
Clinical Presentation of Type 2 Diabetes. Risk Factors for Prediabetes and Type 2 Diabetes. Family history of diabetes mellitus Cardiovascular disease Being overweight or obese Sedentary lifestyle Nonwhite ancestry

E N D
Risk Factors for Prediabetes and Type 2 Diabetes • Family history of diabetes mellitus • Cardiovascular disease • Being overweight or obese • Sedentary lifestyle • Nonwhite ancestry • Previously identified impaired glucose tolerance, impaired fasting glucose, and/or metabolic syndrome • Hypertension • Increased levels of triglycerides, low concentrations of high-density lipoprotein cholesterol, or both • History of gestational diabetes mellitus • Delivery of a baby weighing more than 4 kg (9 lb) • Polycystic ovary syndrome • Antipsychotic therapy for schizophrenia and/or severe bipolar disease HandelsmanY, et al. EndocrPract. 2011;17(suppl 2):1-53.
Development of Type 2 Diabetes Depends on Interplay Between Insulin Resistance and β-Cell Dysfunction Genes & environment Genes & environment • Insulin resistance • No diabetes • Normalβ-Cell Function • Compensatory hyperinsulinemia • Type 2 diabetes • Insulin resistance • Abnormalβ-Cell Function • Relative insulin deficiency Gerich JE. Mayo Clin Proc. 2003;78:447-456.
Etiology of β-cell Dysfunction Genetic predisposition • Lean phenotype • Obese phenotype • Elevated FFA • IGT, IFG • Initial glucolipoadaptation (increased FFA usage) • Hyperglycemia • Oxidative stress and glucotoxicity • Cellular lipid synthesis and glucolipotoxicity • Glucolipotoxicity and glucotoxicity • Progressive -cell failure and type 2 diabetes Poitout V, Robertson RP. Endocrine Rev. 2008;29:351-366.
Nonprogressors NGT NGT NGT NGT IGT Progressors DIA Progression to Type 2 Diabetes: “Falling Off the Curve” 500 400 300 Acute insulin response (U/mL) 20 0 100 0 0 1 2 3 4 5 Glucose disposal (insulin sensitivity)(mg/kg EMBS/min) NGT=normal glucose tolerance; IGT=impaired glucose tolerance; EMBS=estimated metabolic body size. Weyer C et al. J Clin Invest. 1999;104:787-794.
Pathophysiology of T2DM DeFronzo RA. Diabetes. 2009;58:773-795
-Cell function Insulin resistance Insulin secretion Postprandial glucose Fasting glucose Macrovascular complications Natural History of Type 2 Diabetes Years from diagnosis 10 5 15 –10 –5 0 Onset Diagnosis Incretin effect Microvascular complications Prediabetes Type 2 diabetes Figure courtesy of CADRE. Adapted from Holman RR. Diabetes Res ClinPract. 1998;40(suppl):S21-S25;Ramlo-Halsted BA, Edelman SV. Prim Care. 1999;26:771-789; Nathan DM. N Engl J Med. 2002;347:1342-1349; UKPDS Group. Diabetes. 1995;44:1249-1258
UKPDS: -cell Loss Over Time 100 – 75 – 50 – -Cell Function (%) Impaired Glucose Tolerance Postprandial Hyperglycemia 25 – Type 2 Diabetes 0 – l -12 l -10 l -6 l 0 l 2 l 6 l 10 l 14 l -2 Years from Diagnosis Dashed line = extrapolation based on Homeostasis Model Assessment (HOMA) data. Data points from obese UKPDS population, determined by HOMA model. Holman RR. Diabetes Res ClinPract. 1998;40(suppl):S21-S25.
Normal Glucose Homeostasis and Pre- and Postmeal Insulin and Glucagon Dynamics Normal (n=11) 120 Meal 90 Insulin (µU/mL) 60 30 0 140 130 120 Glucagon (pg/mL) 110 100 90 360 330 300 Glucose (mg %) 270 240 110 80 -60 0 60 120 180 240 Time (min) Müller WA, et al. N Engl J Med. 1970;283:109-115.
Hyperglycemia in Type 2 Diabetes Results from Abnormal Insulin and Glucagon Dynamics Normal (n=11) 120 Meal T2DM (n=12) 90 Insulin (µU/mL) 60 30 0 140 130 120 Glucagon (pg/mL) 110 100 90 360 330 300 Glucose (mg %) 270 240 110 80 -60 0 60 120 180 240 Time (min) Müller WA, et al. N Engl J Med. 1970;283:109-115.
Acute Insulin Response Is Reduced in Type 2 Diabetes 1st 2nd phase 20 g glucose infusion 120 Normal (n=85) 100 Type 2 diabetes (n=160) 80 60 Plasma IRI (µU/ml) 40 20 0 -30 0 30 60 90 120 Time (minutes) IRI=immunoreactive insulin. Pfeifer MA, et al. Am J Med. 1981;70:579-588.
7 6 5 4 3 2 1 0 Defective Insulin Action in T2DM 12 8 Total Body Glucose Uptake (mg/kg • min) Leg Glucose Uptake (mg/kg leg wt per min) 4 P<0.01 0 Normal T2DM 0 20 60 100 140 180 Time (minutes) DeFronzo RA, et al. J Clin Invest. 1979;63:939-946; DeFronzo RA, et al. J Clin Invest. 1985;76:149-155.
Elevated Fasting Glucose in Type 2 Diabetes Results From Increased HGP 4.0 3.5 r=0.85P<0.001 3.0 Basal HGP(mg/kg • min) 2.5 Control 2.0 T2DM 100 200 300 FPG (mg/dL) DeFronzo RA, et al. Metabolism. 1989;38:387-395.
Type 2 Diabetes: A Progressive Disease 79,000,000 25,800,000 Primary prevention Secondary prevention Tertiary prevention Garber AJ, et al. Endocr Pract. 2008;14:933-46. CDC. National diabetes fact sheet, 2011. http://www.cdc.gov/diabetes/pubs/pdf/ndfs_2011.pdf.
Summary: Hyperglycemia in Type 2 Diabetes • Hyperglycemia results from the combination of • Pancreatic -cell dysfunction, resulting in impaired insulin secretion • Increased hepatic glucose production due to excessive glucagon • Decreased peripheral glucose uptake due to insulin resistance Handelsman Y, et al.EndocrPract. 2011;17(suppl 2):1-53.