Methods(cont.)
Figure 1: Histogram of Normalized Prediction Distribution Error. Case Study – Bridging from Western to East Asian Population in Accordance with ICH E5 I. Freedman 1 1 GlaxoSmithKline Biopharm Clinical Pharmacology & Biometrics. Introduction

Methods(cont.)
E N D
Presentation Transcript
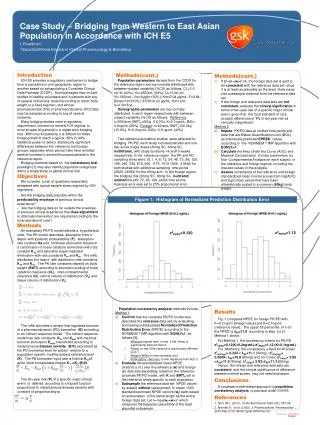
Figure 1: Histogram of Normalized Prediction Distribution Error Case Study – Bridging from Western to East Asian Population in Accordance with ICH E5 I. Freedman1 1GlaxoSmithKline Biopharm Clinical Pharmacology & Biometrics • Introduction • ICH E5 provides a regulatory mechanism to bridge from a population in one geographic region to another based on extrapolating a Complete Clinical Data Package (CCDP). Such packages may include studies in healthy volunteers and in patients with any of several indications, dosed according to either body weight or a fixed regimen, and whose pharmacokinetic (PK) or pharmacodynamic (PD) data may be sampled according to any of several schemes. • Many bridging studies meet a regulatory requirement, common to several ICH regions, to enrol at least 40 patients in a registration bridging trial. With only 40 patients, it is difficult for these bridging trials to reach a typical 80% to 90% statistical power to detect statistically significant differences between the reference and foreign groups, especially when pivotal trials have enrolled several hundred to several thousand patients in the reference region. • Bridging methods based on the consistency trial paradigm [1] may also identify population subgroups within a single study or global clinical trial. • Objectives • We consider a pair of questions reasonably answered with typical sample sizes required by ICH regulators: • Are the bridging data plausibly within the predictabilityenvelope of previous clinical experience? • Are the bridging data so far outside the envelope of previous clinical experience that dose adjustment or alternate intervention are required according to the local standard of care? • Methods • An exemplary PK/PD model defines a hypothetical mAb. The PK model describes absorption from a depot with systemic bioavailability (F), absorption rate constant Ka and, nonlinear elimination based on a combination of linear catabolic elimination with rate constant K10 and saturable target mediated elimination with rate constants Vmand Km. The mAb distributes into tissue with distribution rate constants K12 and K21. The PK rate constants depend on body weight (BWT) according to allometric scaling of linear catabolic clearance (CL), inter-compartmental clearance (Q), central volume of distribution (Vc)and tissue volume of distribution (Vt). • The mAb activates a sensor that regulates turnover of a pharmacodynamic (PD) biomarker (B) according • to an indirect response model. The indirect response model has rate constants Kinand Kout with maximal turnover stimulation Emax transduced according to instantaneous disease severity (B/K) expressed as the PD biomarker level for patient relative to a population-specific healthy subject reference level (K). The PD biomarker input rate is fixed at Kin=1 while initial homeostasis implies Kout=Kin/B(0). • The ten-year risk (P) of a specific major clinical event is defined according to a hazard function proportional to instantaneous disease severity with constant of proportionality α. Methods(cont.) Methods(cont.) If z2=(v-<w>)2 ≤λ, the foreign data set is said to be consistent with the reference data set, since it is at least as plausible as the least likely same size subsample obtained from the reference data set. If the foreign and reference data sets are not consistent, evaluate the clinical significance in terms of ten-year risk of a specific major clinical event, given that the local standard of care accepts differences of 1% in ten-year risk as clinically insignificant. Method 2 Impute PK/PDdata at omitted time points and data that are Below Quantification Limit (BQL) as individually predicted EPRED values according to the NONMEM 7 IMP algorithm with EONLY=1. Calculate the Area Under the Curve (AUC) and Maximal Concentration (Cmax) parameters by Non-Compartmental Analysis for each subject in the reference and foreign regions, including the imputed values in the analysis. Assess consistency of the reference and foreign standardized mean normal scores from log(AUC) and log(Cmax) values that have been allometrically scaled to a common (60kg) body weight. Results Fig. 1 compares NPDE for foreign PK/PD with K=0.2 ng/ml (foreign value) and K=0.1ng/mL (reference value). The upper 95 percentile of λ for the NPDE is λ95=11.0 according to step (c) of Method 1 above. For Method 1, the consistency criteria for PK/PD: z2PKPD=0.12(K=0.2ng/mL);z2PKPD=1.12 (K=0.1ng/mL) For Method 2, the consistency criteria for AUClast: z2AUClast= 0.323 < λ95=11.1 (30mg) ; z2AUClast= 0.0609< λ95=10.8 (60mg) and, for Cmax: z2Cmax= 3.85<λ95=11.9 (30mg); z2Cmax= 2.82<λ95=11.3 (60mg). Hence, the foreign and reference data sets are consistent and the clinical significance of difference between normal scores may not need evaluation. Conclusions A covariate model-based approach to population consistency analysis is practical under ICH E5. References 1. Shih, W.J. (2001), Controlled Clinical Trials (22),:357-66 2. Brendel. K. et al. (2009), J. Pharmacokinet .Pharmacodyn ., 2010 Feb; 37(1):49-65; Epub 2009 Dec 23. Population parameters derived from the CCDP for the reference region are log-normally distributed with between-subject variability (%CV) as follows: CL=3.0 mL/hr (40%); Vc=2500mL (50%); Q=15 mL/hr; Vt=1300mL; Vm=5μg/hr (50%); Km=0.04 μg/mL; F=0.64; Emax=10.0(10%); EC50=0.22 μg/mL; Kin=1/hr; α=0.0018/yr. Demographic parameters are log-normally distributed in each region respectively with between-subject variability (%CV) as follows: Reference: n=500/arm, BWT0=60kg (10.0%), K=0.1ng/mL, B(0)= 0.8ng/mL (25%); Foreign: n=20/arm, BWT0=50.0kg (10.0%), K=0.2ng/mL, B(0)= 0.6 ng/mL (40%) . Two reference simulation studies were selected for bridging PK/PD; each study included placebo and one two active single doses (30mg SC, 60mg SC, n=500/arm), with study durations 14 and19 weeks respectively. In the reference region the PK and PD sampling times were (0,1, 4, 8, 12, 24, 48, 72, 96, 120, 168, 240, 336, 672, 840, 1176, 1512,1848, 2184)h for both studies with additional sampling time points (2520, 2856)h for the 60mg arm. In the foreign region, the bridging trial (30mg SC, 60mg SC, n=20/arm) omitted the (48, 72, 96, 120, 240)h time points. Residual error was set to 25% proportional error. z2PKPD=1.12 z2PKPD=0.120 • Population consistency analysis methods include: • Method 1 • Confirm that the covariate PK/PD model well-describes the reference data set, by evaluating and testing individualized Normalized Prediction Distribution Error (NPDE) according to the NONMEM 7 IMP algorithm with EONLY=1, as follows [2]: • Wilcoxon signed rank, to test if the mean is significantly different from 0, • Fisher, to test if the variance is significantly different from 1, • Shapiro-Wilks, to test normality, and • Kolmogorov –Smirnov, to test departure from N(0,1). • Evaluate the standardized mean NPDE (mean/s.e.m.) over the reference (w) and foreign (v) data sets separately, based on the reference covariate PK/PD model, with K and BWT0set to the reference levels specific to each population. • Subsample the reference data set NPDE values by subject without replacement to obtain 1000 standardized mean NPDE vectors (wi) each based on subsamples of the same length as the entire foreign data set. Let λ=max(wi-<w>)2 which measures the Bayesian plausibility of the least plausible subsample.