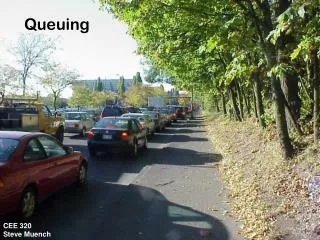
Queuing
Queuing. CEE 320 Steve Muench. Outline. Fundamentals Poisson Distribution Notation Applications Analysis Graphical Numerical Example. Fundamentals of Queuing Theory. Microscopic traffic flow Arrivals Uniform or random Departures Uniform or random Service rate Departure channels

Queuing
E N D
Presentation Transcript
Queuing CEE 320Steve Muench
Outline • Fundamentals • Poisson Distribution • Notation • Applications • Analysis • Graphical • Numerical • Example
Fundamentals of Queuing Theory • Microscopic traffic flow • Arrivals • Uniform or random • Departures • Uniform or random • Service rate • Departure channels • Discipline • FIFO and LIFO are most popular • FIFO is more prevalent in traffic engineering
Poisson Distribution • Count distribution • Uses discrete values • Different than a continuous distribution
Poisson Ideas • Probability of exactly 4 vehicles arriving • P(n=4) • Probability of less than 4 vehicles arriving • P(n<4) = P(0) + P(1) + P(2) + P(3) • Probability of 4 or more vehicles arriving • P(n≥4) = 1 – P(n<4) = 1 - P(0) + P(1) + P(2) + P(3) • Amount of time between arrival of successive vehicles
Poisson Distribution Example Vehicle arrivals at the Olympic National Park main gate are assumed Poisson distributed with an average arrival rate of 1 vehicle every 5 minutes. What is the probability of the following: • Exactly 2 vehicles arrive in a 15 minute interval? • Less than 2 vehicles arrive in a 15 minute interval? • More than 2 vehicles arrive in a 15 minute interval? From HCM 2000
Example Calculations Exactly 2: Less than 2: More than 2:
Queue Notation Number of service channels • Popular notations: • D/D/1, M/D/1, M/M/1, M/M/N • D = deterministic distribution • M = exponential distribution Arrival rate nature Departure rate nature
Queuing Theory Applications • D/D/1 • Use only when absolutely sure that both arrivals and departures are deterministic • M/D/1 • Controls unaffected by neighboring controls • M/M/1 or M/M/N • General case • Factors that could affect your analysis: • Neighboring system (system of signals) • Time-dependent variations in arrivals and departures • Peak hour effects in traffic volumes, human service rate changes • Breakdown in discipline • People jumping queues! More than one vehicle in a lane! • Time-dependent service channel variations • Grocery store counter lines
Total vehicle delay Queue Analysis – Graphical D/D/1 Queue Departure Rate Delay of nth arriving vehicle Arrival Rate Maximum queue Vehicles Maximum delay Queue at time, t1 t1 Time
Queue Analysis – Numerical • M/D/1 • Average length of queue • Average time waiting in queue • Average time spent in system λ = arrival rate μ = departure rate
Queue Analysis – Numerical • M/M/1 • Average length of queue • Average time waiting in queue • Average time spent in system λ = arrival rate μ = departure rate
Queue Analysis – Numerical • M/M/N • Average length of queue • Average time waiting in queue • Average time spent in system λ = arrival rate μ = departure rate
M/M/N – More Stuff • Probability of having no vehicles • Probability of having n vehicles • Probability of being in a queue λ = arrival rate μ = departure rate
Example 1 You are entering Bank of America Arena at Hec Edmunson Pavilion to watch a basketball game. There is only one ticket line to purchase tickets. Each ticket purchase takes an average of 18 seconds. The average arrival rate is 3 persons/minute. Find the average length of queue and average waiting time in queue assuming M/M/1 queuing.
Example 2 You are now in line to get into the Arena. There are 3 operating turnstiles with one ticket-taker each. On average it takes 3 seconds for a ticket-taker to process your ticket and allow entry. The average arrival rate is 40 persons/minute. Find the average length of queue, average waiting time in queue assuming M/M/N queuing. What is the probability of having exactly 5 people in the system?
Example 3 You are now inside the Arena. They are passing out Harry the Husky doggy bags as a free giveaway. There is only one person passing these out and a line has formed behind her. It takes her exactly 6 seconds to hand out a doggy bag and the arrival rate averages 9 people/minute. Find the average length of queue, average waiting time in queue, and average time spent in the system assuming M/D/1 queuing.
Primary References • Mannering, F.L.; Kilareski, W.P. and Washburn, S.S. (2003). Principles of Highway Engineering and Traffic Analysis, Third Edition (Draft). Chapter 5 • Transportation Research Board. (2000). Highway Capacity Manual 2000. National Research Council, Washington, D.C.