Basic Graphs
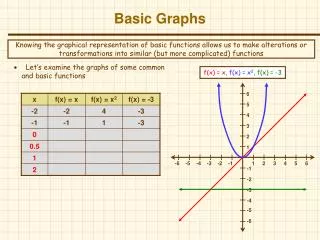
Basic Graphs. Knowing the graphical representation of basic functions allows us to make alterations or transformations into similar (but more complicated) functions. Let’s examine the graphs of some common and basic functions. f(x) = x , f(x) = x 2 , f(x) = -3. 6. 5. 4. 3. 2. 1. -6.

Basic Graphs
E N D
Presentation Transcript
Basic Graphs Knowing the graphical representation of basic functions allows us to make alterations or transformations into similar (but more complicated) functions • Let’s examine the graphs of some common and basic functions f(x) = x, f(x) = x2, f(x) = -3 6 5 4 3 2 1 -6 -5 -4 -3 -2 -1 1 2 3 4 5 6 -1 -2 -3 -4 -5 -6
Basic Graphs Knowing the graphical representation of basic functions allows us to make alterations or transformations into similar (but more complicated) functions f(x) = |x|, f(x) = sqrt(x), f(x) = x3 6 5 4 3 2 1 -6 -5 -4 -3 -2 -1 1 2 3 4 5 6 -1 -2 -3 -4 -5 -6
Transformations • Now let’s review some basic transformations and their effects • Basically, the question becomes what is being affected by the addition / multiplication of a constant • The x variable (just the independent variable) => horizontal effect • The y variable (or f(x) as a whole) => vertical effect
Vertical Shifts • Vertical shifts (the “y” or entire function is changed by some constant) • The graph of y = f(x) + c is the graph of y = f(x) shifted up vertically by c units • The graph of y = f(x) - c is the graph of y = f(x) shifted down vertically by c units 6 5 4 3 2 1 -6 -5 -4 -3 -2 -1 1 2 3 4 5 6 -1 -2 -3 -4 -5 -6
Horizontal Shifts • Horizontal shifts (the “x” or independent variable is changed by some constant) • The graph of y = f(x + c) is the graph of y = f(x) shifted to the left (opposite the sign) by c units • The graph of y = f(x - c) is the graph of y = f(x) shifted to the right (opposite the sign) by c units 6 5 4 3 2 1 -6 -5 -4 -3 -2 -1 1 2 3 4 5 6 -1 -2 -3 -4 -5 -6
Example Graphs Horizontal Shifts Vertical Shifts f(x) = x - 2, g(x) = x2 + 1 f(x) = (x – 3)2,g(x) = sqrt(x + 1), h(x) = (x – 3)2 - 2 6 6 5 5 4 4 3 3 2 2 1 1 -6 -5 -4 -3 -2 -1 1 2 3 4 5 6 -6 -5 -4 -3 -2 -1 1 2 3 4 5 6 -1 -1 -2 -2 -3 -3 -4 -4 -5 -5 -6 -6
Reflections (graph is the same but reflected about the x / y axis) The graph of y = -f(x) is the graph of y = f(x) reflected about the x-axis (y values are changing) The graph of y = f(-x) is the graph of y = f(x) reflected about the y-axis (we’re changing the independent variable x) Reflections 6 5 4 3 2 1 -6 -5 -4 -3 -2 -1 1 2 3 4 5 6 -1 -2 -3 -4 -5 -6
Stretching / shrinking (graph is the stretched or shrunk vertically / horizontally) The graph of y = cf(x) is the graph of y = f(x) vertically stretched (multiplies y-coordinates by c) Think of grabbing the top and bottom of the graph and stretching it The graph of y = f(cx) is the graph of y = f(x) horizontally stretched (mult. x-coordinates by c) Stretching / Shrinking 6 5 4 3 2 1 -6 -5 -4 -3 -2 -1 1 2 3 4 5 6 -1 -2 -3 -4 -5 -6
Example Graphs Reflections Stretching / Shrinking f(x) = -sqrt(x), g(x) = -x3, h(x) = sqrt(-x) f(x) = 2sqrt(x), g(x) = sqrt(2x), h(x) = ½x2 6 6 5 5 4 4 3 3 2 2 1 1 -6 -5 -4 -3 -2 -1 1 2 3 4 5 6 -6 -5 -4 -3 -2 -1 1 2 3 4 5 6 -1 -1 -2 -2 -3 -3 -4 -4 -5 -5 -6 -6
Multiple Transformations Book problems: 53,55,59,63,67,69,77,81,83,87,95,100,103,107,109,115 • These basic transformations can be applied to functions (graphs) individually or in combination with one another • Look at a couple of HW exercises as an example 6 6 5 5 4 4 3 3 2 2 1 1 -6 -5 -4 -3 -2 -1 1 2 3 4 5 6 -6 -5 -4 -3 -2 -1 1 2 3 4 5 6 -1 -1 -2 -2 -3 -3 -4 -4 -5 -5 -6 -6