Download
1 / 46
460 likes | 653 Vues
The Lay of the Land in Agriculture. 2014 Farm Management Profitability Conference Lamberton, Minnesota Mar. 26, 2014 Chad Hart Associate Professor/Crop Markets Specialist chart@iastate.edu 515-294-9911. U.S. Corn Supply and Use. Source: USDA-WAOB for 2010-13. U.S. Soybean Supply and Use.

E N D
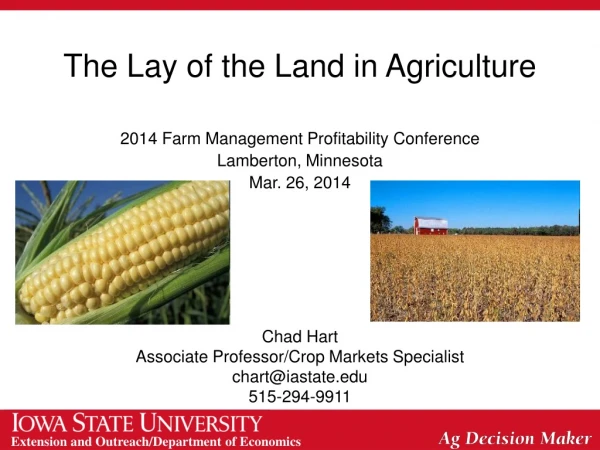
The Lay of the Land in Agriculture 2014 Farm Management Profitability Conference Lamberton, Minnesota Mar. 26, 2014 Chad Hart Associate Professor/Crop Markets Specialist chart@iastate.edu 515-294-9911
U.S. Corn Supply and Use Source: USDA-WAOB for 2010-13
U.S. Soybean Supply and Use Source: USDA-WAOB for 2010-13
Corn Yields Top: 2013 Yield Bottom: Change from 2012 Units: Bushels/acre Source: USDA-NASS
Soybean Yields Top: 2013 Yield Bottom: Change from 2012 Units: Bushels/acre Source: USDA-NASS
World Corn Production Source: USDA-WAOB
World Soybean Production Source: USDA-WAOB
Hog Crush Margin The Crush Margin is the return after the pig, corn and soybean meal costs. Carcass weight: 200 pounds Pig price: 50% of 5 mth out lean hog futures Corn: 10 bushels per pig Soybean meal: 150 pounds per pig Source: ISU Extension
Cattle Crush Margin The Crush Margin is the return after the feeder steer and corn costs. Live weight: 1250 pounds Feeder weight: 750 pounds Corn: 50 bushels per head Source: ISU Extension
U.S. Meat Production & Prices Source: USDA-WAOB
Corn Export Shifts Source: USDA-FAS
Corn Export Sales Source: USDA-FAS
Soybean Export Sales Source: USDA-FAS
Soy Export Shifts Source: USDA-FAS
Current Corn Futures 4.64 4.60 4.58 Source: CME Group, 3/21/2014
Current Soybean Futures 12.98 11.44 10.85 Source: CME Group, 3/21/2014
Corn Prices vs. Costs Per Bushel Cost calculated as Per Acre Cost from ISU Extension divided by Actual Yield per Acre Sources: USDA-NASS for Prices, Duffy for Costs
Soybean Prices vs. Costs Per Bushel Cost calculated as Per Acre Cost from ISU Extension divided by Actual Yield per Acre Sources: USDA-NASS for Prices, Duffy for Costs
3-Month Temperature Outlook Source: NOAA-CPC
3-Month Precipitation Outlook Source: NOAA-CPC
Thoughts for 2014 and Beyond • Supply/demand concerns • Demand rebounding? Yes, so far, so good • Acreage allocation for 2014: Where do the extra corn acres go? • Markets favoring soybeans in the short term and corn longer term • Dry soils to start, but El Niño watch for summer
Farm Bill: Old vs. New Direct Payments (DP) Countercyclical Payments (CCP) Marketing Loans (LDP) Revenue Countercyclical Payments (ACRE) • Countercyclical Payments (PLC) • Marketing Loans (LDP) • Revenue Countercyclical Payments (ARC) New programs, but they have strong similarities to previous programs
What Stayed the Same? Loan Rates Set by law Corn $1.95 Wheat $2.94 Soybean $5.00 Sorghum $1.95 Barley $1.95 Oats $1.39
Two Waves First wave: Choice on base acreage and yield updating Probably occurs June-July timeframe Second wave: Choice on farm bill programs Probably Sept-Oct Harvest the crop and farm bill at the same time
Base Acres Keep current base acres or do a one-time “reallocation” of base acres Reallocation allowed to covered commodities planted between 2009 and 2012 Reallocation in proportion to the ratio of 4-yr average plantings/prevented plantings Total number of base acres limited to total of existing base acres
Payment Yields Keep current CCP payment yield or do a one-time “update” of payment yield on a commodity-by-commodity basis Update: 90% of 2008-2012 yield per planted acre on the farm If the farm yield is below 75% of the 2008-2012 average county yield, then the farm yield is replaced by 75% of the 2008-2012 average county yield County yield: planted or harvested?
Payment Acres For PLC and ARC at the county level, 85% of base acres For ARC at the individual level, 65% of base acres
Producer Choice Have one-time choice between: PLC or ARC (can pick by commodity) If ARC is chosen, pick between county and individual coverage If individual coverage is chosen, must be taken for all covered commodities on the farm 2014-2018 crop years
Reference Prices Reference Prices Corn $3.70 Wheat $5.50 Soybean $8.40 Sorghum $3.95 Barley $4.95 Oats $2.40 • Old Target Prices • Corn $2.63 • Wheat $4.17 • Soybean $6.00 • Sorghum $2.63 • Barley $2.63 • Oats $1.79
PLC instead of CCP Price-based support program Reference prices establish targets Works like CCP Payment rate = Max(0, Reference price – Max(MYA price, Loan rate)) Payment = Payment rate * Payment yield * Payment acres
ARC instead of ACRE Revenue-based support program Revenues based on 5-year Olympic average yields and prices Yields and prices have cups (County T-yields and reference prices) Triggers at county or individual farm level, instead of state level
ARC Payment Rate Payment rate = Max(0, Min(10% of Benchmark revenue, Actual crop revenue – ARC guarantee)) So the basic payment structure is the same as it was under ACRE
Revenue Programs • Think of ARC-County as crop-by-crop • Think of ARC-Individual as whole farm
Conservation • Conservation Reserve Program • 27.5 million acres in 2014 • 26 million acres in 2015 • 25 million acres in 2016 • 24 million acres in 2017 and 2018 • Grassland enrollment capped at 2 million acres
Supplemental Coverage Option (SCO) • An additional policy to cover “shallow losses” • Shallow loss = part of the deductible on the producer’s underlying crop insurance policy • SCO has a county-level payment trigger • Indemnities are paid when the county experiences losses greater than 14% • Premium subsidy: 65% • Starts in 2015 • Can’t have ARC and SCO together
Thank you for your time!Any questions?My web site:http://www.econ.iastate.edu/~chart/Iowa Farm Outlook:http://www.econ.iastate.edu/ifo/Ag Decision Maker:http://www.extension.iastate.edu/agdm/