Download
1 / 5
50 likes | 447 Vues
C: control. A: A. radicina. Figure S 1 A and B. 450 400 350 300 250 200 150 100 50 0. A. Dau c 1.01/ Ubiquitin. B. 450 400 350 300 250 200 150 100 50 0. Dau c 1.02/ Ubiquitin. C C A C A C A C A

E N D
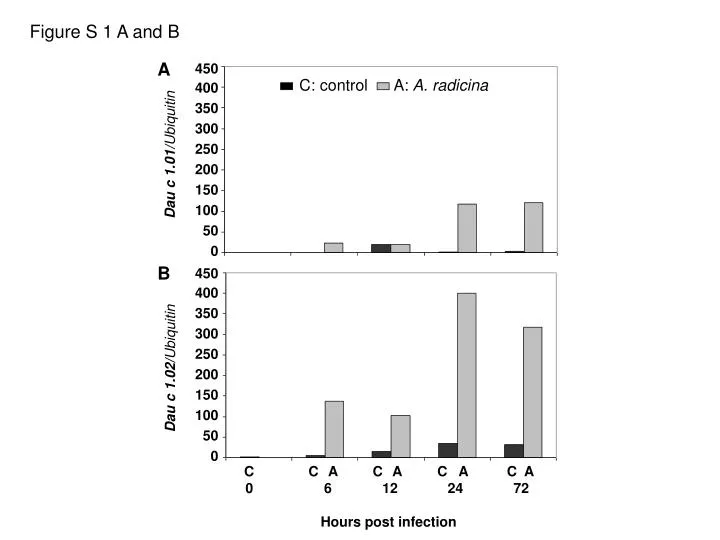
C: control A: A. radicina Figure S 1 A and B 450 400 350 300 250 200 150 100 50 0 A Dau c 1.01/Ubiquitin B 450 400 350 300 250 200 150 100 50 0 Dau c 1.02/Ubiquitin C C A C A C A C A 061224 72 Hours post infection
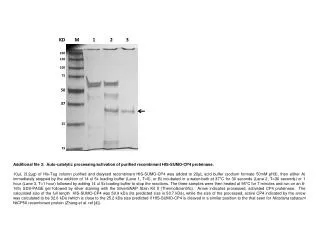
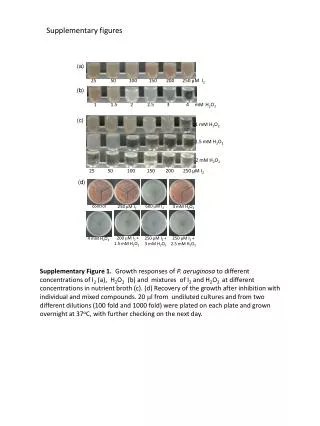
Fig. S 1: Accumulation of Dau c 1 mRNAs (synonymic DcPR10) in field grown carrots upon challenge with the fungal pathogen Alternaria radicina. Slices (0.5 cm thick) from the middle part of 4-month-old fresh roots of the cultivar Rodelika were placed on moist filter paper in a petridish. The slices were inoculated with 105 conidia (10 µl aqueous suspension) and incubated at RT in the dark. Transcripts of Dau c 1.01 (A) and Dau c 1.02 (B) were determined by qPCR at the indicated time points. Values are given relative the ubiquitin RNA.
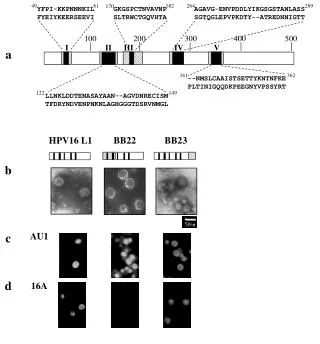
Figure S 2 Fig. S 2: Schematic representation of the T-DNA region inserted into plant transformation RNAi vector pK7GWIWG2(II). A 253 nt fragment of Dauc 1.01 (A) and 267 nt fragment of Dauc 1.02 (B) were inserted separately in sense and anti sense orientation into vector pK7GWIWG2(II), resulting in plasmids pK7GW_Dau c 1.01_RNAi and pK7GW_Dau c 1.02_RNAi.
Table S 1: Clinical and serologic characterization of patients with carrot allergy. (OAS = oral allergy syndrome. ImmunoCAP classes and kilounits per liter (kUA/L) are related as follows: <0.35 kUA/L = class 0; 0.35 to ≤0.7 kUA/L = class 1; >0.7 to ≤3.5 kUA/L = class 2; >3.5 to ≤17.5 kUA/L = class 3; >17.5 to ≤50 kUA/L = class 4; >50 to ≤100 kUA/L = class 5; >100 kUA/L = class 6.).