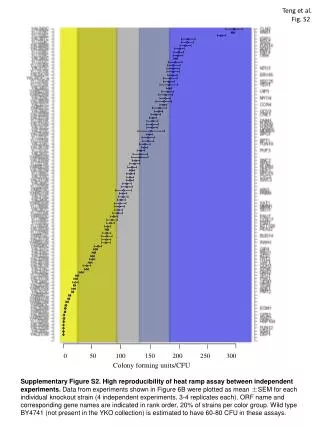
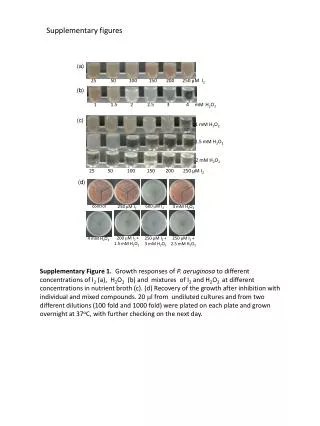
Download
1 / 29
290 likes | 308 Vues
Explore the concept of demand, its law, and effects on pricing with examples. Learn the Law of Diminishing Marginal Utility and graphing demand curves.

E N D
200 175 150 125 100 75 50 25 Price, costs, and revenue Q 0 1 2 3 4 5 6 7 8 9 10 $9 8 7 6 5 4 3 2 MC ATC D MR A monopoly making a profit
Connection to Circular Flow Model • Do individuals supply or demand? • Do business supply or demand? • Who demands in the product market? • Who supplies in the product market?
DEMAND DEFINED What is Demand? Demand is the different quantities of goods that consumers are willing and able to buy at different prices. (Ex: Bill Gates is able to purchase a Ferrari, but if he isn’t willing he has NO demand for one) What is the Law of Demand? The law of demand states There is an INVERSE relationship between price and quantity demanded
LAW OF DEMAND As Price Falls… …Quantity Demanded Rises As Price Rises… …Quantity Demanded Falls Quantity Demanded Price
Example of Demand I am willing to sell several A’s in AP Macro. How much will you pay? Demand Schedule
Why does the Law of Demand occur? The law of demand is the result of three separate behavior patterns that overlap: • The Substitution effect • The Income effect • The Law of Diminishing Marginal Utility We will define and explain each…
The substitution effect occurs when consumers react to an increase in a good’s price by consuming less of that good and more of another substitute goods (and vice versa) The income effect happens as a lower price increases the real purchasing power of the consumer-allowing them to purchase more. Why does the Law of Demand occur? 1. The Substitution Effect 2. The Income Effect
Utility = Satisfaction We buy goods because we get utility from them The law of diminishing marginal utilitystates that as you consume more units of any good, the additional satisfaction from each additional new unit will begin to diminish (decline). In other words, the more you buy of ANY GOOD the less satisfaction you get from each new unit. Discussion Questions: What does this have to do with the Law of Demand? How does this effect the pricing of businesses? Why does the Law of Demand occur? 3. Law of Diminishing Marginal Utility U- TIL- IT- Y
The Demand Curve • A demand curve is a graphical representation of a demand schedule. • The demand curve is downward sloping showing the inverse relationship between price (on the y-axis) and quantity demanded (on the x-axis) • When reading a demand curve, assume all outside factors, such as income, are held constant. Let’s draw a new demand curve for corn…
P QD GRAPHING DEMAND Draw this in your notes big Price of Corn Demand Schedule P $5 4 3 2 1 CORN 10 20 35 55 80 $5 4 3 2 1 o Q 10 20 30 40 50 60 70 80 Quantity of Corn
P QD GRAPHING DEMAND Price of Corn P $5 4 3 2 1 Plot the Points CORN 10 20 35 55 80 $5 4 3 2 1 o Q 10 20 30 40 50 60 70 80 Quantity of Corn
P QD GRAPHING DEMAND Price of Corn P $5 4 3 2 1 Plot the Points CORN 10 20 35 55 80 $5 4 3 2 1 o 55 Q 10 20 30 40 50 60 70 80 Quantity of Corn
P QD GRAPHING DEMAND Price of Corn P $5 4 3 2 1 Plot the Points CORN 10 20 35 55 80 $5 4 3 2 1 o Q 10 20 30 40 50 60 70 80 35 Quantity of Corn
P QD GRAPHING DEMAND Price of Corn P $5 4 3 2 1 Plot the Points CORN 10 20 35 55 80 $5 4 3 2 1 o Q 10 20 30 40 50 60 70 80 Quantity of Corn
P QD GRAPHING DEMAND Price of Corn P $5 4 3 2 1 Plot the Points CORN 10 20 35 55 80 $5 4 3 2 1 o Q 10 20 30 40 50 60 70 80 Quantity of Corn
P QD GRAPHING DEMAND Price of Corn P $5 4 3 2 1 Connect the Points CORN 10 20 35 55 80 $5 4 3 2 1 Demand o Q Corn 10 20 30 40 50 60 70 80 Quantity of Corn