Experimentation and Graphing
Experimentation and Graphing. Objectives: 1. Students will learn about the importance of keeping good records and notes when doing experiments. 2. Students will understand relationships such as linear and quadratics when graphing data. Recording Data: The Laboratory Notebook.

Experimentation and Graphing
E N D
Presentation Transcript
Experimentation and Graphing Objectives: 1. Students will learn about the importance of keeping good records and notes when doing experiments.2. Students will understand relationships such as linear and quadratics when graphing data.
Organizing the Experiment Your instructor will ask you to write a formal report or you may respond to questions based on information recorded in your notebook. To fully benefit from the experience of having performed the experiment, it is helpful to approach each experiment as if you designed it yourself. That way you will have the best understanding of what you were trying to observe and what you did observe. Keep in mind that the neater and more organized you are, the easier it will be to write reports and/or make conclusions based on your results. The following outline of points will help you get started in organizing your experiments. A sample experiment will be used to illustrate the points.
Creating Proper Data Tables • Collect data in a note book. Use Pen for a more permanent record of your work.
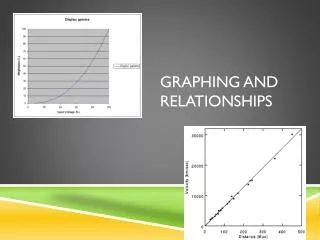
Graphing • The following is taken from a driver’s manual and shows data for stopping an automobile on dry pavement. • Draw a graph of thinking distance versus velocity. Find the slope of the curve at the point on the curve where the velocity equals 15 m/s. • Draw a graph of total stopping distance versus velocity. Find the slope of the curve at the point where the velocity equals 20 m/s.
Graphing • The following data was taken from a physics laboratory experiment. • a). Draw a graph of velocity versus time and determine the value of the slope of the curve at (4,15). • b). Give the units of the slope.
Graphs show relationships • In graph A, what happens to y as x is increased? ____Decrease_____ • In graph A, what happens to x as y is increased? ____Decrease_______ • What type of relationship exists between x and y in graph A? _Inverse_ • In graph B, what happens to y as x is increased? __Increase_______ • In graph B, what happens to x as y is increased? ___ Increase ________ • What type of relationship exists between x and y in graph B? _Linear__ Give them answers….
Linear Graphs In these expressions, the symbol (delta) means “change”, and (x1, y1) and (x2, y2) are points on the linear curve. This is illustrated in the graph below.
The significance of Slope When graphing physical data from an experiment, the slope of the linear graph generally has physical meaning. The quantities graphed have units associated with them, so the slope will have units as well. For example, suppose you plot a graph with position, measured in meters, on the vertical axis and time, measured in seconds, on the horizontal axis. The slope is the change in vertical values over change in horizontal values, or in this case, change in position over change in time. What would the units of the slope be? _M/Sec (Speed)_ What would the physical meaning of the slope of the line be? ___How fast you were moving (speedometer reading)___________ When graphing data from experiments, the slope almost always has physical meaning, and should be reported along with the units and physical interpretation.
The significance of the Y-Intercept Another characteristic of a linear graph is its y intercept. This is the point where the curve crosses the y axis. Since it is a point on the y axis, it will have whatever units the y axis has, and so will in general have a physical interpretation. For example, in the previously discussed position vs. time graph, the line crosses the axis at some y value when the x value, in this case time, is equal to zero. Since you have a position at time t = 0 s, the intercept would represent the position of the object being studied at the time the clock was started, that is, at time t = 0 s.
Understanding Check! • For which curve does y increase the most with increasing x? __D__ • For which curve does y increase the least with increasing x? ___A___ • Which curve has a slope of zero? __B____ • Calculate the slope of curve A between the points (0, 0) and (6, 1). __1/6____ Between points (6, 1) and (12, 2). __ 1/6 ___ What did you notice about the slope? __It was the same. Hence it was constant through out the time frame___You could say it was a constant slope._________ • Calculate the slope of curve C between the points (4, 1) and (8, 2) _1/4__ Between the points (0, 0) and (8, 2). __ 1/4 ___ What did you notice about the slope? _ It was the same. Hence it was constant through out the time frame however it was more steep than the first calculated slope we did!____ • Make a generalization about the slope of a linear curve. The steeper the slope the higher the “RATE OF CHANGE” for the graph drawn._________
More understanding checks! • Find the slope of curve E. __-1_ Find the slope of curve F.__+1__ • Make a generalization about the sign of the slope of a linear curve and the appearance of that curve.
Quadratic Graphs What happens to the value of y as the value of x increases? _increases__ When x2 was plotted on the horizontal axis instead of x, what happened to the shape of the curve?__It becomes linear rather than a quadratic or parabolic shape._____ What type of a relationship is shown by the second graph (y versus x2)? _It is linear__ What is the slope of the graph of y versus x2?__The slope is 2_ What is the relationship between this slope and the original relationship y = 2x2? _It is the Constant number in front of the x2 Term__ In the two graphs drawn for this example, you can see that changing the independent variable can change the shape of the curve. Since the linear relationship between variables is the easiest to work with, you may find it convenient to perform appropriate mathematical operations on your experimental data to convert a quadratic or other relationship into a linear relationship for analysis.
Obtaining Information from Graphs As an example, suppose that as a car races to town, data on its time and distance are recorded. The data is plotted on the graph shown below. We want to find the speed of the car at t = 3 seconds, which will be given by the slope of the curve at the point t = 3 s. We find the tangent line and take the slope.
Practice finding slopes Practice finding the slope of a curve by using a tangent line by estimating the slope of the curve in the following graph at points A, B and C, which is the graph of an object’s velocity as a function of time. Be careful to get the sign of the slope correct (signs are important). A _Positive_ B __ZERO (0)__ C __Negative___ Describe the motion of the object in words.
Requirements for Scientific Graphs • When choosing scales for the axes of a graph, choose scales that will cause the graph to fill the area of the page designated for the graph. If you are using a computer graphing utility, this will usually occur automatically. However, if the computer does not choose an appropriate scale, you should manually adjust the scaling on the graph until the graph fills the allotted space. • The physical data plotted on a graph will in general have units associated with it. Both axes should be labeled showing the quantity being plotted, its units, and the symbol used to represent that quantity. for example, if you were plotting velocity on one axis, you might label that axis with “velocity (v) m/s”. If you are using a computer graphing program, this information must be typed into the computer.
Requirements for Scientific Graphs • The graph should have an appropriate title that is indicative of the physical situation being represented by the graph. For example, if you were graphing data collected for a falling golf ball, you might title the graph “Motion of a Golf Ball in Free Fall”. Do NOT title your graph “y vs. t” or “position vs. time”. This information can be obtained by looking at the axis labels. Such titles are commonly the default titles for computer graphing programs, but they say nothing about the actual physical situation being represented. Change the title to something descriptive. Other information that should be included in the title block of a hand-drawn graph include the name of the experiment, the date the data was collected, your name, your partners’ names, and any other information that might be relevant. If you are creating a computer generated graph, this additional information should be typed into the text box of the graph. • The best fit curve should be indicated. This can be done with a ruler for linear graphs, or with a French curve or flexible curve for other graphs. If the graph is linear, the slope should be indicated along with its units. If you are using a computer graphing utility, the best fit equation for the curve (linear or otherwise) should be displayed. Many graphing programs do not display the units for the terms in the best fit equation. If yours does not you should write in the units by hand or type them into the text box.
Data Analysis • Manipulate only one variable at a time in an experiment. If other variables are to be investigated, each should be looked at separately, with all other variables held constant. • Collect data over the widest possible range of the manipulated variable. • If you think a linear graph is appropriate, draw the best fit to your data as a smooth line, not a segmented line. In other words, do not play dot-to-dot with the data points. If a linear graph does not seem appropriate, try various functions of the independent variable to see if a linear graph can be generated. Alternately, use a curve-fitting routine in a computer graphing program. • If your graph is linear, use the best-fit line, not the data points, to determine the slope and intercept values.
Best fit lines • If you are using a computer graphing program, the program can perform this calculation for you and in some cases can tell you the expected error in the calculated values for m and b.
Graphing to find relationships • Hopefully you can now take data and determine if the relationship between the variables is linear or a parabolic (quadratic) relationship.