Tables and Graphing
120 likes | 253 Vues
Tables and Graphing. Chapter 2 Section 3. Tables. Tables - these display information in rows and columns so that it is easier to read and understand. Many of our labs we have done and will do contain tables for our information. Graphs.

Tables and Graphing
E N D
Presentation Transcript
Tables and Graphing Chapter 2 Section 3
Tables • Tables- these display information in rows and columns so that it is easier to read and understand. • Many of our labs we have done and will do contain tables for our information.
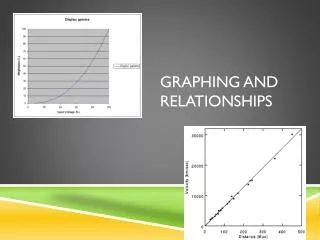
Graphs • Graphs- these are used to collect organize, and summarize data in a visual way. • There are three main graphs used in science • Bar Graph (We used this in the M&M lab) • Line Graph • Pie Graph
Bar Graphs • Bar Graphs- uses rectangular blocks, or bars, of varying sizes to show the relationships among variables. • The Dependent variable (the variable that is being measured) is on the y axis • The Independent variable (the variable that changes) is on the x axis
y x
Line Graph • Line Graph- shows the relationship between two variables. • Both variables in a line graph must be numbers • Often line graphs are used to show something happening over time. • The line shows the relationship between the two variables on the graph
Pie Graph • AKA Circle Graph • Pie Graph-shows the parts of a whole. • It shows things in fractions and percentages. • Making a pie graph • A pie graph is a circle. • A circle is 360 Degrees. • So to find a portion of a pie graph you need to find how much out of 360 Degrees your portion represents.
How to make a pie graph • Remember percentages? • If there are a total of 45 Jedi and 15 of them use a green Lightsaber then the percentage of Jedi with green Lightsabers is: (15/45) * 100 = 33.3% • Take (15/45) * 360 = 120 • 33% of 360 Degrees is 120 Degrees